Historic districts may be preserving racial segregation in DC

Chevy Chase Branch Library, which District government is interested in redeveloping to include affordable housing. Image by DC Public Library.
Earlier this month, a group submitted an application to form a Chevy Chase Historic District. In light of that news, we thought it would be timely to share this post again, originally published in February 2023. (This piece expands upon a 2021 post on CPsmartgrowth.com.)
If you’ve walked the streets of Capitol Hill and its collection of late 19th-century row houses, or up Massachusetts Avenue along Embassy Row, you can appreciate the architecture that’s been preserved by DC’s historically designated districts.
Keep walking, and you’ll find that historic districts are all over DC, located in every Ward. There are over thirty historic districts in residential areas of the District and a dozen or so more in federal and institutional settings.
In 2021, using the software (no longer live) designed for DC’s redistricting process, I realized that I could assemble any grouping of census blocks to immediately calculate the demographics of the selected geography. I could now answer questions that I had often wondered about: What share of DC’s population lives in historic districts? What is the racial make-up of historic-district residents?
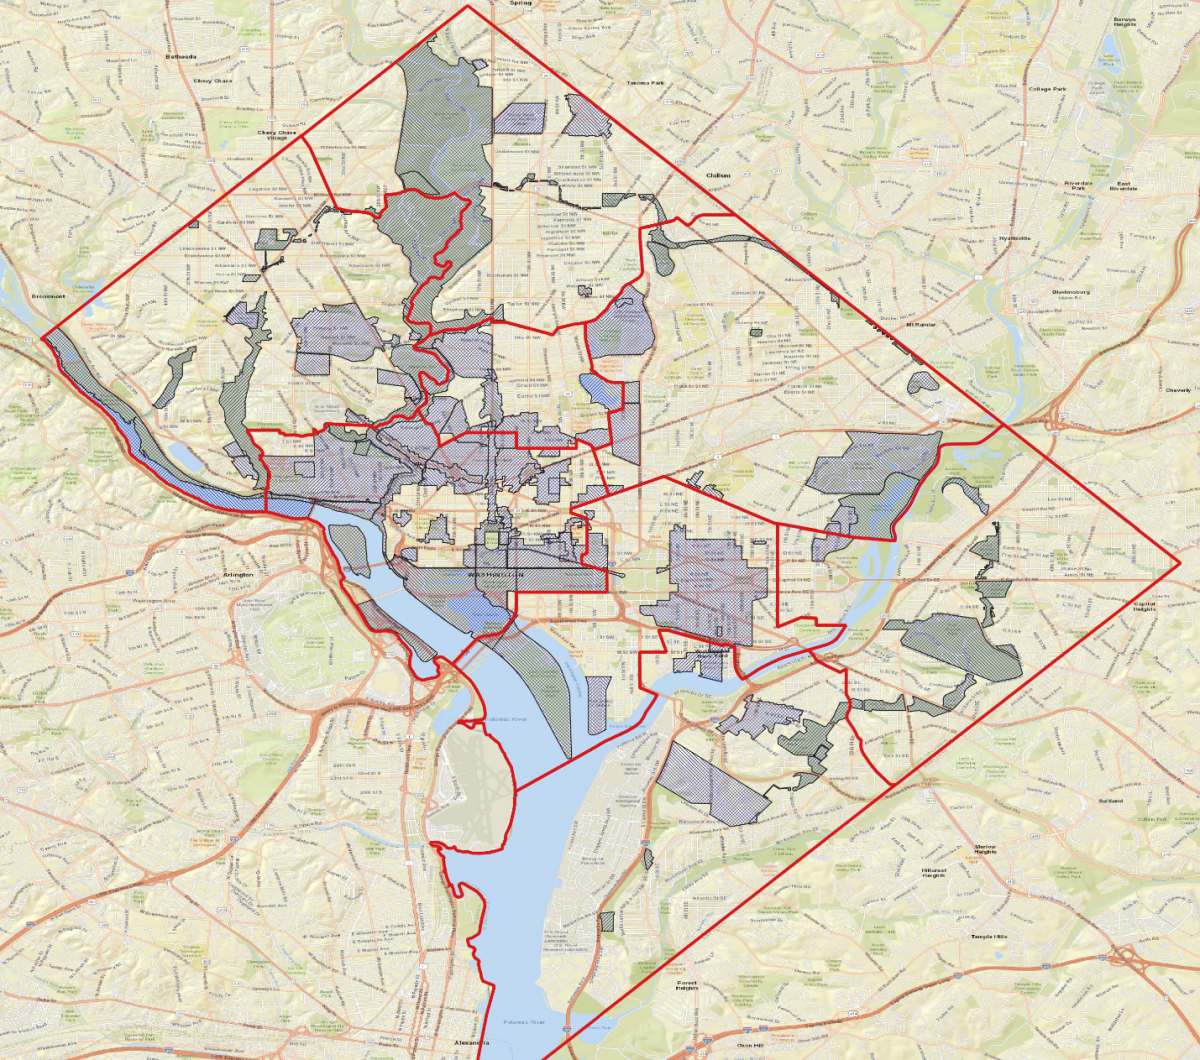
Click, click, click and I was off looking at historic-district maps and trying to recreate them using census blocks. It’s not a perfect match, because many historic districts split census blocks. But what I came up with surprised me: 22 percent of District residents live in a historic district! That strikes me as an incredibly high number and suggests the threshold to become a historic district is pretty low.
More disturbing, though, was the racial profile of areas “protected” by preservation law. They are overwhelmingly white: Historic districts are 62 percent white and 15 percent Black. Outside of historic districts, the District’s population is 49 percent black and 31 percent white. Leave aside why this is so for now; the disparity alone is eye-popping.
| Total population | Non-Hispanic white | Non-Hispanic Black | |
|---|---|---|---|
| Historic districts | 148,784 | 92,519 62% |
22,347 15% |
| Rest of D.C. | 540,761 | 169,252 31% |
266,818 49% |
Author’s analysis using DC redistricting software (no longer live, data files available), 2020 U.S. Census, aggregated census blocks.
While there are historic districts in DC that are majority Black, they are few, and they are small in population. The largest are Kingman Park, Anacostia, and St. Elizabeth’s, which, combined, are about the same population as the Cleveland Park historic district.
The largest historic districts—Capitol Hill, Georgetown, Dupont Circle, Mount Pleasant, and U Street—are all majority white. The whitest historic districts are Kalorama Circle, Cleveland Park, Strivers’ Section (south of Adams Morgan), Washington Heights (Adams Morgan), and Sheridan Kalorama.

White and getting whiter
Some might react to this data and conclude we need more historic districts in areas with majority Black residents. That could make things worse.
Research in New York City from 2016 from New York University’s Furman Center has shown that the designation of historic districts has the impact of changing the demographics of the area in question, finding, “Residents of historic districts were higher income, more highly educated, and more likely to be white.” Moreover, the authors, Ingrid Gould Ellen, Brian J. McCabe, and Eric Stern, found that neighborhoods continued to become higher-income, more highly educated, and whiter after being designated historic.
It is well-known that the District’s demographics have changed significantly in recent decades. In 2010, according to the U.S. Census, the Black population of DC was 305,125. By the 2020 U.S. census, Black population in DC was 285,810, a net decrease of nearly 20,000 Black residents.
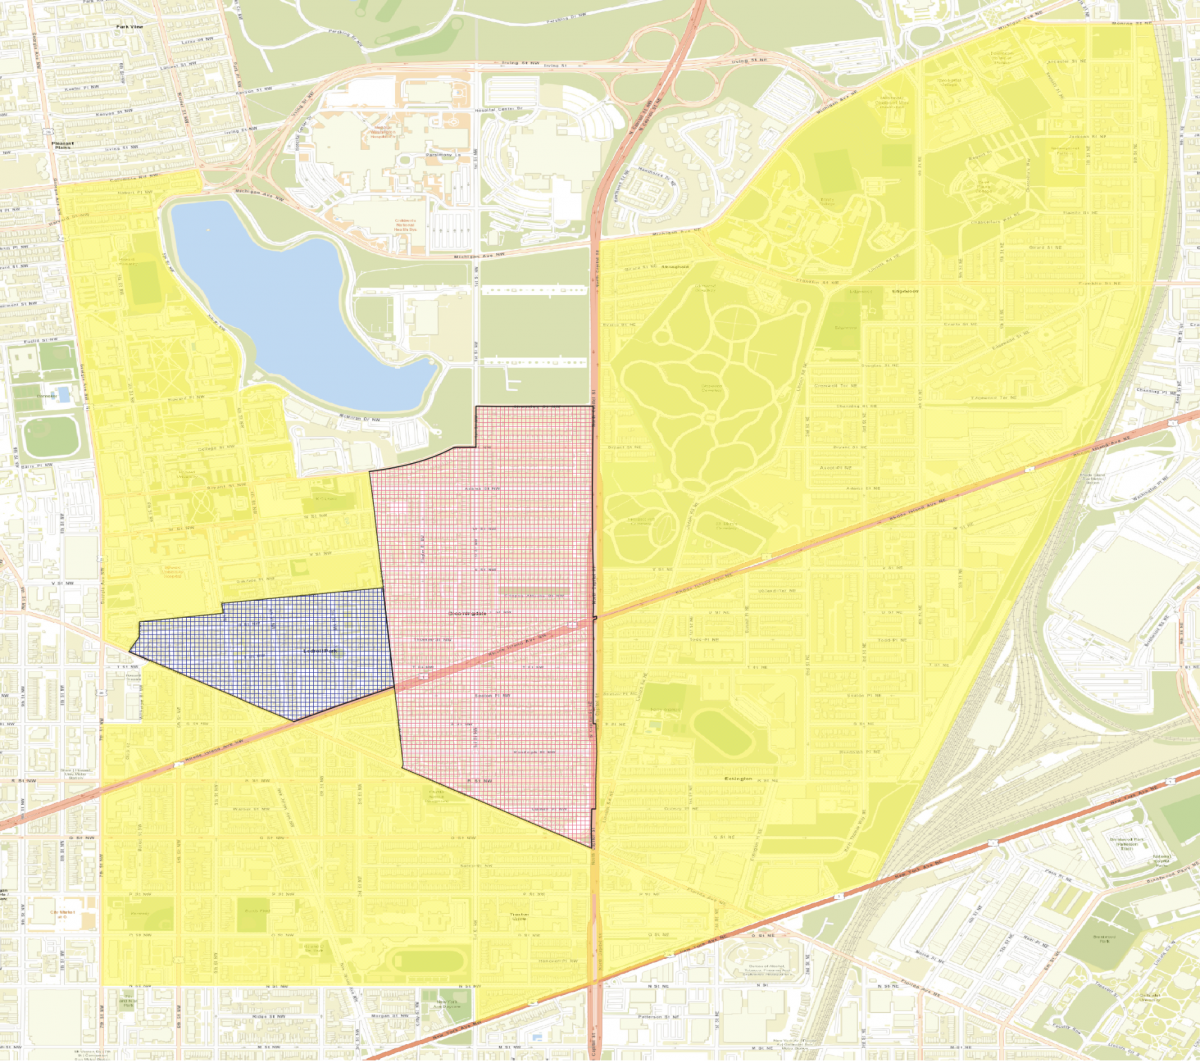
How does this loss of the Black residents differ within and outside of historic districts? Let’s look at two in the heart of DC LeDroit Park has been designated historic for nearly 50 years, and Bloomingdale, which was designated historic between the last two Censuses; both were majority black in 2010. We can also compare these neighborhoods with surrounding areas that are not within historic districts.
| Demographic | Area | 2010 | % share | 2020 | % share | Growth | % growth |
|---|---|---|---|---|---|---|---|
| Population | Bloomingdale HD | 5,789 | 6,258 | +469 | +8% | ||
| LeDroit HD | 1,308 | 1,348 | +40 | +3% | |||
| Non-historic area | 20,520 | 25,388 | +4,868 | +24% | |||
| White-only population | Bloomingdale HD | 1,827 | 32% | 3,220 | 51% | +1,393 | +76% |
| LeDroit HD | 369 | 28% | 694 | 51% | +325 | +88% | |
| Non-historic area | 3,647 | 18% | 8,716 | 34% | +5,069 | +139% | |
| Black-only population | Bloomingdale HD | 3,500 | 60% | 1,972 | 32% | -1,528 | -44% |
| LeDroit HD | 61% | 390 | 29% | -413 | -51% | ||
| Non-historic area | 14,735 | 72% | 11,549 | 45% | -3,186 | -22% |
In each of the three study areas, the Black population decreased. However, the percentage decrease in Black population between 2010 and 2020 (what I consider the rate of displacement) was more than double in the historic districts than it was in adjacent areas outside of those districts.
All three areas—the LeDroit and Bloomingdale historic districts, and surrounding areas not within historic districts—were majority black in 2010. By 2020, the non-historic area had a Black plurality, down to 45 percent from 72 percent, while both historic districts are now majority white.
These are but two historic districts. A more complete analysis by the District is warranted across all historic districts and the areas outside them.
Catalyzing displacement
While this data, along with the research conducted in New York, is not enough to definitively say historic districts cause displacement, there is enough here to suggest it may catalyze it. There are two main reasons why this could be the case.
The first reason is that historic districts, by their very nature, are attractive places to live. Competition for homes in these areas will advantage higher-income home buyers and renters, meaning lower-income residents will have less of an ability to move in.
The second reason, which is compounded by the attraction of higher-income residents, is that historic districts can restrict future growth in housing supply, putting more upward pressure on housing costs, the main cause of displacement. In their article, “Balancing the Costs and Benefits of Historic Preservation,” Ingrid Gould Ellen and Brian McCabe, the same authors who looked at historic districts in New York, say the benefits of historic preservation are self-evident: “The creation of historic districts may help to strengthen neighborhood identity, encourage social cohesion and increase property values by providing certainty about future development.”
But they also found that “historic preservation, like other land use regulations, imposes costs by restricting development,” and that “the creation of historic districts is likely to constrain the development and supply of housing in the future”:
“Specifically, our analyses show that lots inside of historic districts were 2.9 percentage points less likely to see new building activity during this period than lots not regulated by the [Landmarks Preservation Commission] in the very same community district”
“Going forward, we could see density differences, however, as lots within historic districts were less likely to see new buildings than those not under LPC regulation, suggesting that designation was providing some level of protection from development.”
Reinforcing exclusion
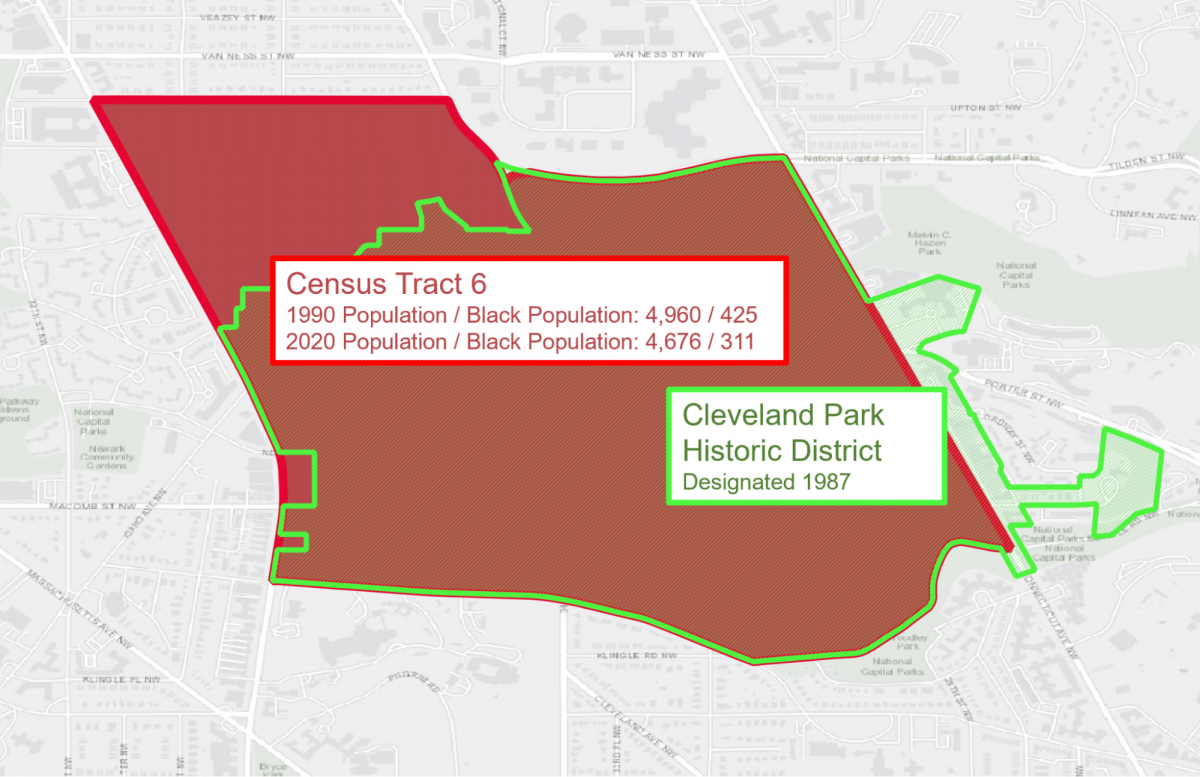
In neighborhoods that were founded with the intention to exclude Black people, like Cleveland Park, and have remained so, historic designations cement the racial composition their founders intended.
The Cleveland Park historic district was designated in 1987, and since then its small Black population has gotten even smaller. The vast majority of residents living in this district reside in census tract 6. At the 1990 census, 425 Black residents lived in census tract 6, making up 8.5 percent of the population. By 2020, the number of residents who indicated they were Black, at least in part, was 311, or 6.7 percent of the population. That is a 27 percent decrease in Cleveland Park’s Black population since the neighborhood was designated as a historic district.
Recently, some residents of Chevy Chase have sought to form a historic district there. Like Cleveland Park, Chevy Chase was formed more than a century ago as an enclave for prosperous whites. It still is. Designating Chevy Chase, or parts of it, as historic could permanently prevent it from being meaningfully racially or economically integrated.
The District does not track, measure, or report how neighborhoods that have been designated historic change. It should, and it should do so for more than race alone. The District should measure, and share with the public, data on incomes, employment, housing costs, and health outcomes in historic districts. Do historic districts advance racial equity, or are they preserving privilege? If a Black neighborhood is designated historic, will that prevent or catalyze displacement?
Historic-district designations are land-use regulations that have actively discouraged the construction of more housing. If we understand that a historic district designation does provide “some level of protection from development” and that some of DC’s historic districts are less Black than they might have been otherwise, it is not a stretch to conclude that “protection” from development is quite possibly leading to displacement. The District should analyze this.
Further, it’s fair to say that, if historic districts aren’t areas of opportunity already, they are quite likely to become areas of opportunity. In the midst of a housing crisis and rapidly shifting demographics (due in large part to said crisis), anything complicating the construction of new housing, and new affordable housing, is the wrong policy for the District.
The District, including the Office of Planning, within which the Historic Preservation Office sits, is engaged in important work establishing racial equity tools to inform its work. The Office of Planning’s racial equity tool is open for comments now. When complete, it should apply to the Historic Preservation Office and should measure demographic and behavioral data related to its historic districts.
Before the Historic Preservation Office or the Historic Preservation Review Board takes any action studying or voting on historic districts or historic-district nominations, whether, in Chevy Chase or elsewhere, the District needs to gather and analyze available data. It is hard to manage what you are not measuring.