Gentrification in DC is not just a black and white issue

Fiesta DC by Caroline Angelo used with permission.
Most conventional debates over gentrification in DC position the process as one that replaces long-time black residents with newer, wealthier white residents. Given the context, this framing makes sense: DC has a well-established black middle class and a wealth of black history. And, the most prominent visual signifiers of change — new buildings — are in neighborhoods like Shaw, which had been nearly entirely black in the postwar era.
We don’t suggest that those narratives should cease. Rather, we’d like to emphasize that this cursory look at demographics does no justice to the burdens, primarily born by minority groups, of the dramatic increase in housing prices over the last 20 years.
This decade, framing DC’s gentrification as a black-white issue has been employed extensively in scholarship and in the media, perhaps best exemplified by Derek Hyra’s 2017 book Cappuccino City. We think that this binary frame, which informs debates on issues ranging from zoning and displacement to bike lanes and churches could benefit from an injection of nuance — and maps!
First, let’s look at a table of population counts.
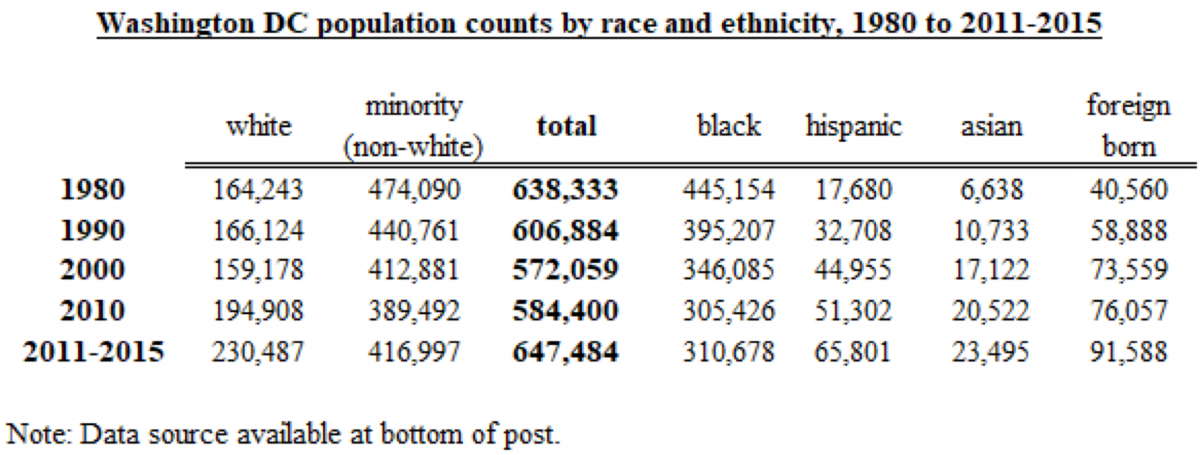
What stands out to you in the above? While it would be possible to write a post on every category in the table, we see a few clear trends that we think are important.
Since 1980, Washington has gained about 66,000 white residents while it has lost about 135,000 black residents. Black population loss has potentially stabilized this decade, while the white population is still growing.
But the differences here do not show a one-for-one replacement of black residents by white residents. While the black population has declined and the white population has increased, the city has also gained nearly 50,000 Hispanic residents.
In fact, from 1980-2000, Hispanic and Asian residents, up by about 17,000, were the only growing categories — in that time period, both the black and white populations in DC were falling. Additionally, Washington’s status as an “international city” has increased: Now, about 14% of DC’s population was born in a different country, more than doubling from about 6% in 1980.
So, while there is a great deal of literature addressing what it means that DC has gained 66,000 white residents from 1980 to 2015, little has been said about how the city has gained the same amount of Hispanic and Asian residents over the same period of time.
Further, even less has been said about the nexus of these issues: immigration, gentrification, and displacement. There are some exceptions, which include Price et al. on DC as an immigrant gateway in Urban Geography, Jonathan Jackson’s paper on racial change in DC in Housing Policy Debate; and Gabriella Gahia Modan’s Turf Wars and Brett Williams’ Upscaling Downtown, both of which use qualitative, ethnographic research to explore racial, class, and cultural tensions in Mount Pleasant.
The maps below provide a visualization of the percentage of residents of each census tract who identified exclusively with a certain race or ethnicity. Maps can help us visualize where the respective populations have increased and decreased. The animations span from 1980 to 2011-2015. What do you notice in the maps below?
We see a few particular trends. The decline of the black population in Mid-City and part of the northeast quadrant (roughly Wards 1, 4, and 5) has steadily decreased over time, yet much of the eastern third of DC is still is majority black.
Concurrently, there has been a dramatic increase in the share of the population that identifies as Hispanic in that same corridor (note that the shares for the Hispanic population in the legend are lower due to lower populations). Finally, the white population has slowly spread eastward across 16th Street into those same areas, as well as around Capitol Hill.
DC is whiter than than it was nearly 40 years ago. But it’s more Hispanic, and more Asian, too.
Image by Caitlin Faw used with permission.
Rightfully and understandably, narratives about how DC has changed have primarily addressed the city’s shift from “Chocolate City” to its present incarnation — that is, they have consistently focused on DC’s black-white dynamic. The Anacostia Community Museum’s A Right to the City exhibit thoughtfully assembles archival research and video interviews to highlight community-driven organizing efforts in certain DC neighborhoods following urban renewal. It features Adams Morgan and Chinatown, but only discusses how those areas’ makeup is unlike what they once were.
The same is true for academic literature and now, legal texts: In the wake of the fervent attention afforded to Hyra’s book, Chris Asch and Derek Musgrove’s Chocolate City was released. It treads similar lines of thought in its research, demonstrating — expansively and impressively — that DC was black, and now it is less so. Local lawyer Ari Theresa’s “creative class” lawsuit alleges that the District government deliberately “whitened” the city through plans it adopted in the late 2000s.
We plan to investigate those issues in further posts. However, given changes in DC’s demographics since 1980, we think there is plenty of room for more scholarship to illuminate the full breadth of the city’s demographic dynamism.
Data Note: Racial and ethnic categories in the table and the animations are exclusive, e.g. white alone (non-hispanic). A small category for “some other race” is not shown. Totals may not sum to 100% due to rounding. Data is compiled via authors’ calculations from decennial census data (1980-2010) spatially adjusted to 2010 census tract boundaries via Brown University’s Longitudinal Tract Database. 2011 to 2015 data is from the American Communities Survey. The authors thank Eli Knaap, PhD of the Center for Geospatial Sciences at the University of California, Riverside for his work in developing the dataset.