This map shows why recent housing construction patterns are troubling news for the climate

A street in Loudoun County by Dan Reed licensed under Creative Commons.
A recent report from Brookings researchers Jenny Schuetz and Matt Ring found that much of the Washington region’s new housing construction over the past 30 years has taken place in exurban areas like Loudoun and Prince William counties.
Although housing production has ramped up in the last decade in DC proper, close-in suburbs are lagging behind; and both are outflanked by housing construction in exurban communities, according to Census data analyzed by the Brookings researchers. According to the Brookings report, “between 60% and 70% of new housing each decade was built in counties that have no Metrorail stations.”
All that housing construction in counties far away from Metro and other transit options is troubling news for the climate. Why? Because according to data from the UC Berkeley CoolClimate Network, households in those exurban communities have on average a much higher carbon footprint than households closer to downtown.
You can see what that looks like visually in this 2013 CoolClimate map of household carbon footprints in the Washington region. DC and Baltimore are blue, signalling low emissions; surrounding zip codes are red, signalling above-average emissions.
Average US carbon footprint by ZIP code by UC Berkeley CoolClimate Network used with permission.
Climate impacts of housing construction take on particular significance in the wake of the recent report from the Intergovernmental Panel on Climate Change (IPCC). That report found that the only way to stave off the worst possible impacts of climate change is to rapidly curb fossil fuel usage and carbon emissions.
The UC Berkeley researchers found that the biggest differences between average carbon footprints arise from household income, vehicle ownership, and home size — wealthier households, those with large homes, and those who own vehicles tend to emit more.
People living in dense cities have low average carbon footprints, but many suburban households actually have higher carbon footprints even than many rural areas. According to the UC Berkeley researchers, suburban households accounted for half of all US household emissions, despite making up less than half of the population. Other research has shown that development in suburban areas boosts carbon dioxide emissions in a way that development in dense urban areas does not.
This pattern holds true in other metropolitan areas. The UC Berkeley researchers have described the pattern as “carbon footprint hurricanes,” with low-intensity “eyes” in city centers and high-intensity rings surrounding them.
Average US carbon footprint, Eastern US by UC Berkeley CoolClimate Network used with permission.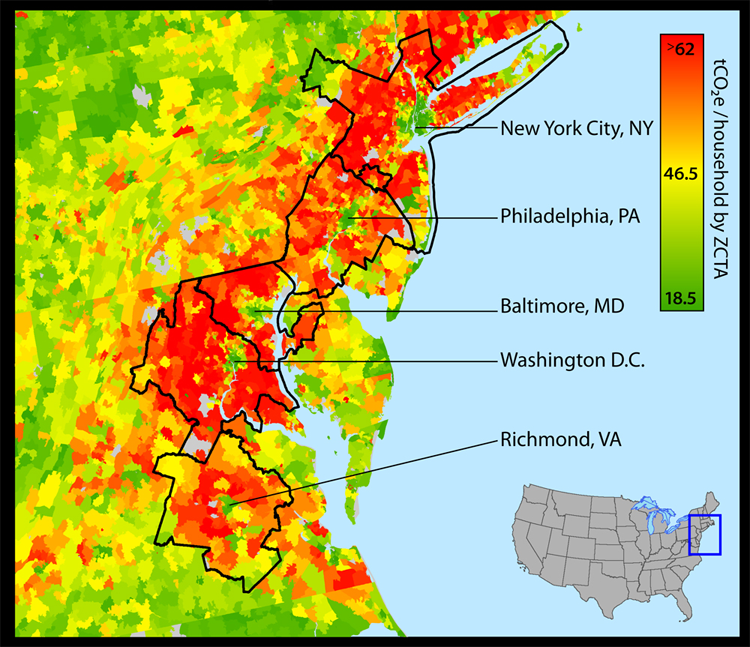
In our region, the areas that stand out as having the highest average carbon footprints are concentrated in outer areas like Prince William County and the “Upcounty” part of Montgomery County. Some areas of Fairfax (such as McLean) and Loudoun counties also make the list.
In contrast, some near-in parts of Arlington, Alexandria, and Prince George’s counties are as low-intensity as most of DC.
Washington isn’t the only place suburban sprawl is showing up. Nationally, a Washington Post analysis last month found that the US developed enough new land to cover an area five times the size of Delaware. According to the Post’s reporting, much of that sprawl happened as housing in dense coastal cities became more expensive.