Pedestrian crash rates are highest in the District’s poorest areas
_800_600_90.jpg)
Image by T. Mertens used with permission.
Last week, Mayor Muriel Bowser proposed a reset of her Vision Zero campaign, acknowledging the unpleasant fact that fatalities have risen over the past several years. Drilling down by ward, it’s clear that the poorest parts of the city have the most crashes compared to the number of people who walk or ride transit.
From 2017 to 2018, the District experienced more than 1,000 crashes that resulted in pedestrian injuries or deaths, with substantial variation across neighborhoods (see Table 1). About one-quarter of these crashes occurred in the city’s Ward 2, more than double the number in any other ward. Ward 2 encompasses the city’s Central Business District, with dense job concentrations around Farragut Square, Metro Center, Dupont Circle, and the eastern edge of Georgetown (see Figure 1).
Forty percent of Ward 2 residents walk to work, and several of Metro’s busiest stations are located in the ward. The neighborhood also attracts high volumes of commuters and tourists, and notably, the amount of pedestrian activity in a neighborhood is a key predictor for the number of pedestrian crashes.
Table 1: Pedestrian casualties vary across District neighborhoods
Crashes with pedestrian death or injury, 2017-2018
Source: Pedestrian crashes from District Department of Transportation “Crashes in DC” dataset. Data covers October 2017 to October 2018. Population and commute mode share data from 2012-2016 American Community Survey. 
After Ward 2, the highest number of pedestrian crashes occurred in Ward 6, which contains other large job centers and tourist attractions, including Capitol Hill, Navy Yard, and Federal Center Southwest. The two wards with the lowest number of pedestrian crashes—Wards 3 and 4—are largely residential areas.
Neighborhood race and wealth affect pedestrian safety
As these figures indicate, one reason some neighborhoods have more pedestrian crashes is that they have more pedestrians. To assess a neighborhood’s safety, it’s thus useful to know not only the total number of crashes it experiences, but also the likelihood that a pedestrian in that neighborhood will be involved in a crash.
The District’s wards have roughly similar populations, around 80,000 residents each, but some wards have more walkers than others. Here, I use the number of commuters living in the neighborhood who either walk or ride public transportation to work as a proxy for the pedestrian population (typical measures of vehicle accident rates use total vehicle miles traveled (VMT) as the denominator, but comparable measures for walking are difficult to obtain).
This measure does not capture residents’ non-work walking trips or activity by incoming neighborhood visitors, but should identify neighborhoods where walking is relatively common.
Map 1: Pedestrian casualties are most common east of the Anacostia
Pedestrian casualties per 1,000 walking/transit commuters, 2017-2018
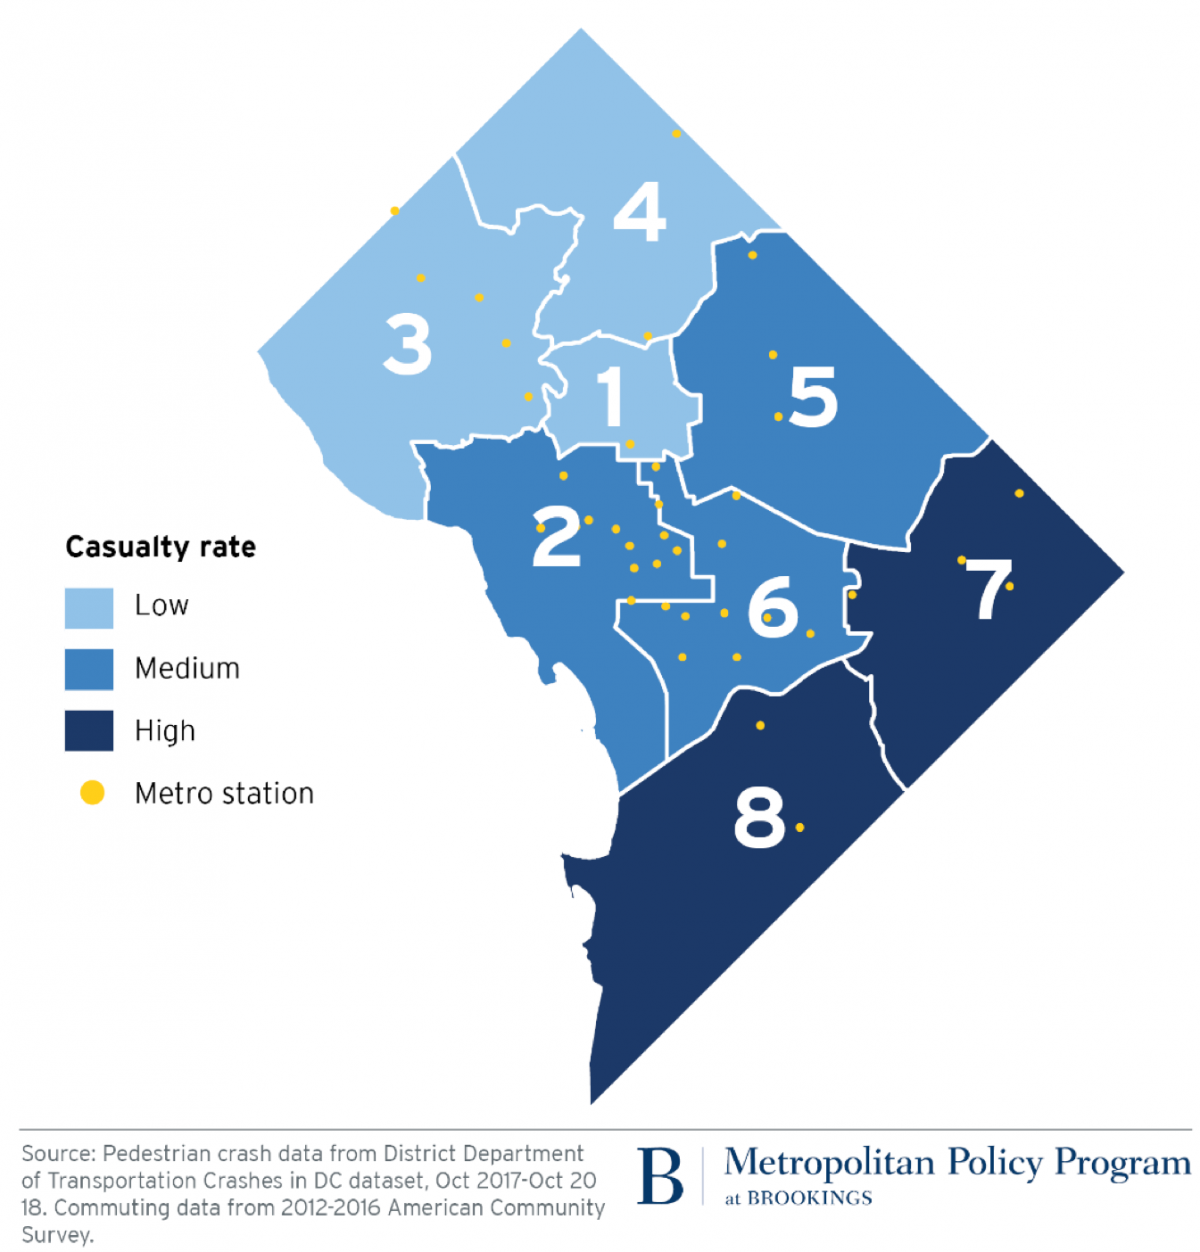
Adjusting for the prevalence of local walking populations suggests that pedestrian safety in the District tracks neighborhood patterns of race and income. The two wards with the highest rate of pedestrian casualties are Wards 7 and 8.
These neighborhoods have a few employment clusters—notably Joint Base Anacostia-Bolling in Ward 8 and local government offices near the Minnesota Avenue Metro station in Ward 7—but do not contain the District’s larger job centers. Fewer than 5% of commuters in either ward walk to work, well below the District’s average. Households in these neighborhoods are less likely to own cars than in the rest of the District.
Wards 7 and 8 contain some of the District’s poorest neighborhoods, and more than 90% of residents are black. Both wards also have above-average shares of children: 24% of Ward 7’s population is under age 18, and 30% in Ward 8, compared to a District average of 17%. Children walking to and from school are a particularly vulnerable population for traffic crashes.
In notable contrast, the ward with the lowest absolute number and rate of pedestrian crashes is Ward 3—home to the District’s wealthiest and whitest neighborhoods.
Pedestrian safety is a window into politics, power, and policy in cities
These results illustrate three larger trends among urban policy beyond Washington, DC:
- Low-income and minority neighborhoods often experience poorer quality public services. From public schools to greenspace access and policing, services provided by local governments tend to favor affluent, white communities. Not all of the factors affecting pedestrian safety are directly within policymakers’ sphere of influence, but they should keep these disparities in mind when deciding where and how to spend limited transportation resources.
- The traditional two-party system is not well designed to address most urban issues. Decisions about how to maintain safe sidewalks and run public schools do not align neatly with national Democratic or Republican party ideologies or platforms. The more salient cleavages are those between owners and renters, families with and without children, drivers and cyclists, and pedestrians. Urban voters of all partisan affiliations could benefit from candidates for local office who more clearly represent interests around specific issues.
- Local elections matter. Vote.
Thanks to David Harshbarger for excellent research assistance. Portions of this post were published on brookings.edu on October 31, 2018.