On average, a driver kills a pedestrian in our region once every four days

Image by pinelife licensed under Creative Commons.
If an infectious disease killed 814 people in the DC metro area, wouldn’t leaders take action?
That’s the number of people on foot that drivers struck and killed in the Washington region between 2005 and 2014. That number makes us the 69th most dangerous place nationally for people walking, according to a new ranking out on Tuesday. In a state-by-state comparison, DC saw 121 pedestrians struck and killed, making the District 49th out of 51.
Image by Smart Growth America.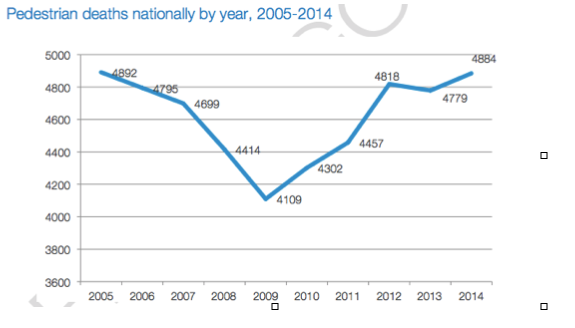
This data is from Dangerous by Design 2016, the fourth edition of the landmark report from Smart Growth America that calculates a Pedestrian Danger Index, or PDI, for the 104 largest metro areas in the United States as well as all 50 states and the District of Columbia. PDI is a calculation of the share of local commuters who walk to work (the best available measure of how many people are likely to be out walking each day) and the most recent data on pedestrian deaths.
In this report, the DC metro area is defined as “Washington, Arlington, Alexandria, DC-VA-MD-WV.”
Based on PDI, the 20 most dangerous metro areas for walking in the United States are:
| 2016 rank | Metro area | 2016 Pedestrian Danger Index |
| 1 | Cape Coral-Fort Myers, FL | 283.1 |
| 2 | Palm Bay-Melbourne-Titusville, FL | 235.2 |
| 3 | Orlando-Kissimmee-Sanford, FL | 234.7 |
| 4 | Jacksonville, FL | 228.7 |
| 5 | Deltona-Daytona Beach-Ormond Beach, FL | 228.2 |
| 6 | Lakeland-Winter Haven, FL | 200.6 |
| 7 | Tampa-St. Petersburg-Clearwater, FL | 192.0 |
| 8 | Jackson, MS | 189.6 |
| 9 | Memphis, TN-MS-AR | 153.3 |
| 10 | North Port-Sarasota-Bradenton, FL | 148.2 |
| 11 | Miami-Fort Lauderdale-West Palm Beach, FL | 145.1 |
| 12 | Bakersfield, CA | 132.8 |
| 13 | Birmingham-Hoover, AL | 132.1 |
| 14 | Little Rock-North Little Rock-Conway, AR | 127.9 |
| 15 | Houston-The Woodlands-Sugar Land, TX | 127.2 |
| 16 | Phoenix-Mesa-Scottsdale, AZ | 125.1 |
| 17 | Detroit-Warren-Dearborn, MI | 124.2 |
| 18 | Riverside-San Bernardino-Ontario, CA | 123.4 |
| 19 | Baton Rouge, LA | 120.6 |
| 20 | McAllen-Edinburg-Mission, TX | 118.8 |
With a PDI score of 43.5, the DC region comes in at number 69 on this national list. DC has a PDI score of 15.4.
People of color, elderly people, and low earners are most at risk
Who are the most vulnerable among these numbers? Nationally, people of color and older adults are overrepresented among pedestrian deaths. In DC, people of color account for 62.4% of the population but more than 78.4% of the pedestrian fatalities.
In addition, the new report finds that PDI is correlated with median household income as well as rates of uninsured individuals. Low-income metro areas are predictably more dangerous than higher-income ones: as median household incomes drop, PDIs rise. Similar trends bear out with rates of uninsured individuals: as rates of uninsured individuals rise, so do PDIs, meaning that the people who can least afford to be injured often live in the most dangerous places for walking.
City by city, things are looking up. State by state, not so much.
PDIs in the majority of metro areas have fallen since 2014. Thirty out of the 51 metro areas became less dangerous, with lower PDIs in 2016 compared to 2014. Entire states, on the other hand, have seen their PDIs rise since 2014. The moral of this story is that we need safer streets. In the DC area and nationally, we must use every tool available to improve safety for pedestrians. Better, safer street design can reduce distracted driving, lower speed limits, create safer crossings and create healthier, cleaner, more livable places for everyone.
Want to look read more and find out how a different metro area stacks up? Check out the full report here.