2020 census numbers show where our region is growing and where it isn’t
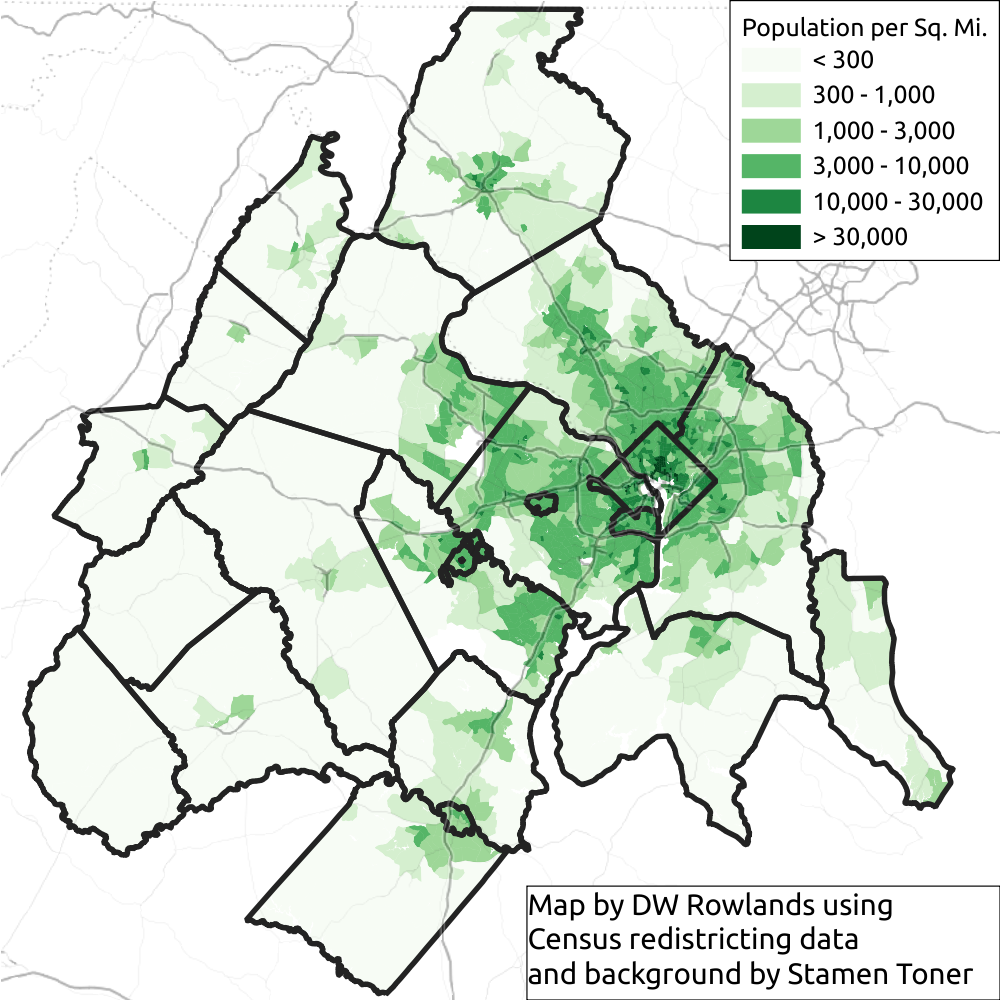
Population density by census tract in the DC metro area, according to 2020 Census results.
Last Thursday, the Census Bureau released the redistricting data from the 2020 census, giving the public its first look at the results for geographic areas smaller than states. What does this data tell us about how our region is growing?
Overall numbers show growth and an increase in diversity
The 2020 census found that the population of the Washington region (that is, the Washington-Arlington-Alexandria, DC-VA-MD-WV Metropolitan Statistical Area) grew by 726,000 people to a total of 6.4 million residents—larger than the population of Maryland—over the past decade. This 13.0% growth rate was nearly twice the US’s 7.1% growth rate during the same period, and the DC area’s population now exceeds that of the Philadelphia metro area, making us the sixth-largest metro area in the country after New York, Los Angeles, Chicago, Dallas, and Houston.
This growth has come with a substantial increase in racial diversity for the region. The metro area’s population was 42.3% non-Hispanic white in 2020, down 6.6 percentage points from 2010. The increase in the non-white population was driven by increases in the Hispanic/Latino (3.4 percentage points), Asian (1.8 percentage points) and non-Hispanic other race or multiracial (2.4 percentage points) populations, while the non-Hispanic Black population dropped by 1 percentage point from 25.1% to 24.1% of the region’s population. The growth of the Hispanic, Asian, and multiracial populations in the Washington region is part of a larger national trend, as increases in these populations were responsible for nearly all of the US’s population growth over the past decade.
| % of Population in 2010 | % of Population in 2020 | Percentage Point Shift | |
| Non-Hispanic White | 48.9% | 42.3% | –6.6 |
| Non-Hispanic Black | 25.1% | 24.1% | –1.0 |
| Hispanic/Latino | 13.7% | 17.1% | 3.4 |
| Non-Hispanic Asian | 9.1% | 10.9% | 1.8 |
| Non-Hispanic Other Race or Multiracial | 3.2% | 5.6% | 2.4 |
Unfortunately, we have not built new housing fast enough to keep up with population growth, contributing to the region’s high housing costs. The region’s housing inventory increased by 11.5% (259,000 units) to 2.5 million housing units over the past decade. That means that one new housing unit has been built for every 2.8 new residents while, in 2010, the region had one housing unit for every 2.5 residents.
Which jurisdictions are growing fastest?
While every jurisdiction in the region except for Rappahannock County, VA (which fell from 7,373 to 7348 residents) saw population growth over the past decade, the rate of this growth varied substantially. Among the region’s ten largest jurisdictions, the highest growth rates were seen in Loudoun County (38.4%), Prince William County (20.0%), and Frederick County (16.4%), while the lowest were seen in Prince George’s County (12.0%), Montgomery County (9.3%) and Fairfax County (6.3%), as seen in the table before.
| 2020 Population | 2020 Share of Metro Population | Population Growth | Growth Rate | |
| Fairfax County, VA | 1,150,000 | 18.0% | 69,000 | 6.3% |
| Montgomery County, MD | 1,062,000 | 16.6% | 90,000 | 9.3% |
| Prince George’s County, MD | 967,000 | 15.1% | 104,000 | 12.0% |
| District of Columbia | 690,000 | 10.8% | 88,000 | 14.6% |
| Prince Wiliam County, VA | 482,000 | 7.5% | 80,000 | 20.0% |
| Loudoun County, VA | 421,000 | 6.6% | 109,000 | 34.8% |
| Frederick County, MD | 272,000 | 4.3% | 38,000 | 16.4% |
| Arlington County, VA | 239,000 | 3.7% | 31,000 | 14.9% |
| Charles County, MD | 167,000 | 2.6% | 20,000 | 13.7% |
| Alexandria, VA | 159,000 | 2.5% | 20,000 | 13.9% |
While the three big inner-suburban jurisdictions of Fairfax County, Montgomery County, and Prince George’s County grew slower than the region as a whole (13.0%), the three core urban jurisdictions grew slightly faster than it: Arlington County grew by 14.9%, the District of Columbia grew by 14.6%, and Alexandria grew by 13.9%. In general, however, the highest growth rates were in the outer suburban and exurban jurisdictions closer to the region’s edge, part of a broader pattern of national population growth being fed primarily by exurban sprawl.
Population density by census tract in the DC metro area in 2010 and 2020 
The rapid growth of Loudoun and Prince William Counties — three to five times the state’s growth rate of 7.8% over the last decade — pushed Prince William County ahead of Virginia Beach to become Virginia’s second-largest jurisdiction and lifted Loudoun County to fourth place in the state, ahead of Chesterfield County in the Richmond suburbs. In addition, the Virginia portion of the metro area grew by 14.4%, nearly twice the state rate, and 35% of Virginia’s population is now found in Northern Virginia.
Population change by census tract in the DC metro area from 2010 to 2020. 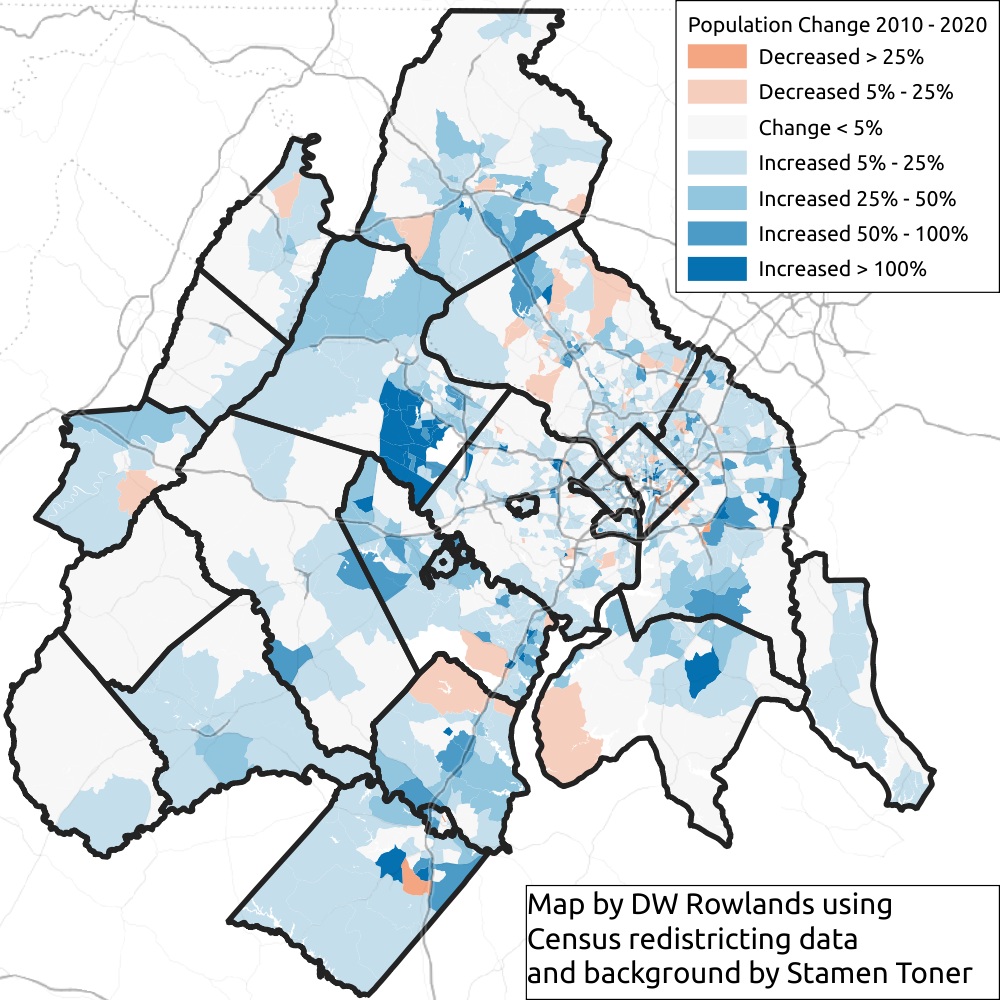
While the fastest growth in the region happened in the outer suburbs, there was also rapid growth in dense, transit-oriented areas in the region’s core. In the District, the largest growth was seen in NoMa, Navy Yard, and The Wharf, and substantial growth also occurred in Downtown Silver Spring and Bethesda in Montgomery County and in Potomac Yard in Alexandria.
Population density by census tract in the core of the DC metro area in 2010 and 2020 
In Fairfax County, which grew the slowest of the region’s large jurisdictions, growth seems to have been concentrated in a few dense, mixed-use suburban clusters in Tysons, Dunn Loring-Merrifield, and Reston Town Center. However, the faster growth in the other two large inner-suburban jurisdictions, Montgomery County and Prince George’s County, seems to have occurred mostly in greenfield developments outside the Beltway.
Population change by census tract in the core of the DC metro area from 2010 to 2020. 
This two-pronged growth pattern, with large population increases in both exurban greenfields and a few areas of dense redevelopment in the core, but little growth in between, is a consequence of the land-use choices our region has made. With large fractions of the region — three-quarters in Fairfax County — zoned for only single-family homes, there simply aren’t many places where it is possible to build housing for the region’s new residents except for sprawling, car-oriented greenfield developments on the region’s periphery.
Growth has driven demographic transitions in several jurisdictions
As in the region as a whole, population growth in most jurisdictions—the one significant exception is the District of Columbia itself—has been driven by increases in people of color while the non-Hispanic white fraction of the population has fallen. Jurisdictions on the region’s periphery that had largely white, rural populations in 2010 now have substantial populations of people of color, and the region has acquired several new jurisdictions where the majority of residents are people of color.
Percentage of people of color by census tract in the DC metro area in 2010 and 2020. 
The majority of residents in Alexandria and Fairfax County are now people of color, joining the District, Prince George’s County, and Montgomery County, and leaving Arlington County (58.6% non-Hispanic white) and the cities of Fairfax (53.5% non-Hispanic white) and Falls Church (67.9% non-Hispanic white) the only majority-white jurisdictions in the region’s core.
| 2020 Population | Percentage Who Identified as People of Color in 2010 | Percentage Who Identified as People of Color in 2020 | Percentage Point Shift | |
| Fairfax County, VA | 1,150,000 | 45.4% | 52.9% | 7.5 |
| Montgomery County, MD | 1,062,000 | 50.7% | 59.4% | 8.7 |
| Prince George’s County, MD | 967,000 | 85.1% | 88.7% | 3.6 |
| District of Columbia | 690,000 | 65.2% | 62.0% | –3.2 |
| Prince Wiliam County, VA | 482,000 | 51.3% | 61.6% | 10.3 |
| Loudoun County, VA | 421,000 | 37.6% | 48.5% | 10.9 |
| Frederick County, MD | 272,000 | 22.2% | 32.4% | 10.2 |
| Arlington County, VA | 239,000 | 36.0% | 41.4% | 5.4 |
| Charles County, MD | 167,000 | 51.6% | 65.9% | 14.3 |
| Alexandria, VA | 159,000 | 46.5% | 50.8% | 4.3 |
The population growth for people of color has been even greater in the region’s fast-growing suburbs, with increases of over ten percentage points in Loudoun, Prince William, and Frederick counties and 14.3% in Charles County. Prince William County’s population is now 61.6% people of color, and it now has the largest percentage of Hispanic and Latino residents of the region’s large jurisdictions, 25.2%. (Prince George’s County is in second place at 21.2%.) The two independent cities Prince William County, Manassas and Manassas Park have 42.9% and 45.3% Hispanic and Latino residents, and if these populations grow at the same rate as they did during the previous decade—over ten percentage points in both cases—they will be the region’s first majority-Latino jurisdictions by 2030.
Percentage of people of color by census tract in the core of the DC metro area in 2010 and 2020. 
While the region’s Latino and Asian populations are relatively widely distributed, the new development around Dulles Airport includes large majority- and plurality-Asian neighborhoods, and Loudoun County now has the largest Asian population in the region (21.2%), followed by Fairfax County (20.3%) and Fairfax City (18.7%). The belt of Hispanic and Latino neighborhoods along the Montgomery-Prince George’s border and south of East-West Highway in Prince George’s County have also grown substantially, making it possible that the county will have its first majority-Latino County Council district after the 2022 redistricting.
Racial and ethnic breakdown by census tract in the core of the DC metro area in 2010 and 2020. 
Meanwhile, while gentrification has continued to displace Black neighborhoods in DC, the northern portion of Charles County has become nearly entirely majority or plurality Black. However, with a non-Hispanic Black population of 48.5%, Charles County is just shy of becoming the region’s second majority-Black county after Prince George’s.
Methodology
For this article, I used the “PL94171” package in R to process the Census Bureau’s legacy format redistricting data files from 2010 and 2020. My jurisdiction-level analysis is done with the county-level data from the files, as I don’t believe jurisdiction boundaries in the MSA have changed since 2010.
For tract-level analysis, I used 2020 Census tracts and TigerLine shapefiles from the Census Bureau, obtained with the “tigris” package in R.
Tract-level 2020 census data was taken directly from the legacy-format data files, while block-group-level 2010 data from the legacy-format data files was transferred into 2020 tracts using area-weighted integration and the R package “areal.”
Note: The author is using the census term and definition for Hispanic/Latino in this piece. All references to populations of people of a given race refer to Census counts of people who identified themselves as a member of only that race and as not Hispanic/Latino. Also where a single race or ethnicity could not be used, the term people of color was applied.
Correction: An earlier version of this article incorrectly stated the percentage of Virginia’s population that resides in Northern Virginia. The article has been updated to reflect this change.