How bike crashes shifted out of downtown DC during the pandemic

A bicyclist on the street in DC by Joe Flood licensed under Creative Commons.
Throughout this year travel restrictions, business closures, and expanded telework as a result of the COVID-19 pandemic have had a significant impact on the transit habits of DC. Data from the Open Data DC portal on bike crashes in the District shows that bicycle habits in the city have indeed been altered by the pandemic.
From a top-line look, the pandemic this year seems to have flattened the usual summer spike of bicycle accidents. Total bicycle crashes between March and August in 2020 as compared to 2019 dipped from 404 to 163 — an almost 60% year-over-year change.
It should, however, be noted that there were a total of 27 traffic deaths throughout DC in 2019, and 29 overall traffic deaths in DC as of August 2020, according to Vision zero data. GGWash contributor and cyclist Dave Salovesh was killed by a driver in April 2019. There were no fatalities involving cyclists in the District in 2020 so far.
Bicycle crashes between March and August of 2019 and 2020. Image by the author.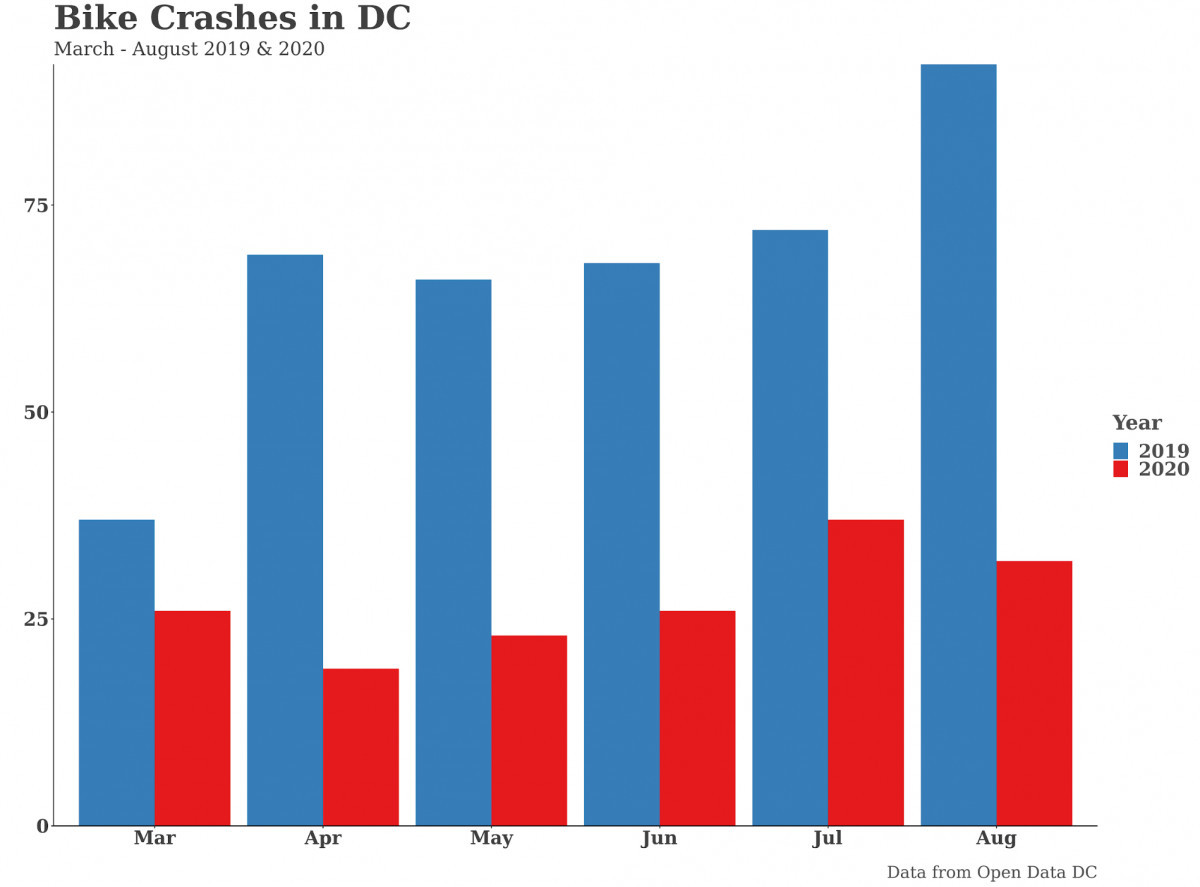
Honing in on the distribution of these crashes between wards and it becomes clear that the bulk of the bicycle crashes reductions have been in Ward 2 and Ward 6. The two wards have experienced a decline of 116.4 and 77.8 bike crashes per 100,000 residents between 2019 and 2020, respectively. These drops in bike crashes come while Wards 5 and 8 have barely experienced any changes at all in the same period.
Bicycle crash rates by ward in 2019 and 2020. Image by the author.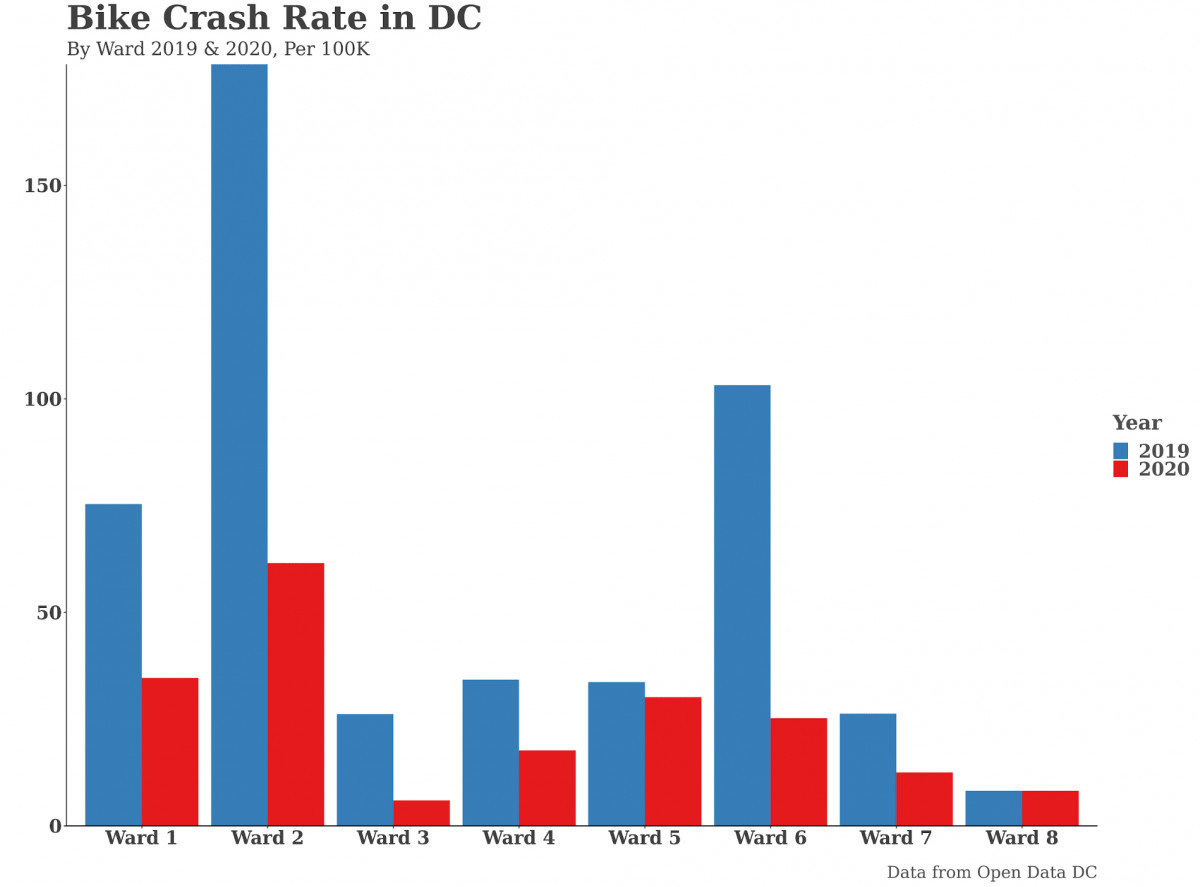
A cluster analysis map provides a more granular view of how exactly the locations of bike crashes in DC have changed from the spring and summer of last year as compared to this year. The map of 2019 bike crashes in the region shows the Farragut Square business district and the area around Union Station as two of the most frequent centers of bike crashes.
Bicycle crashes by type and neighborhood location in 2019. Image by the author.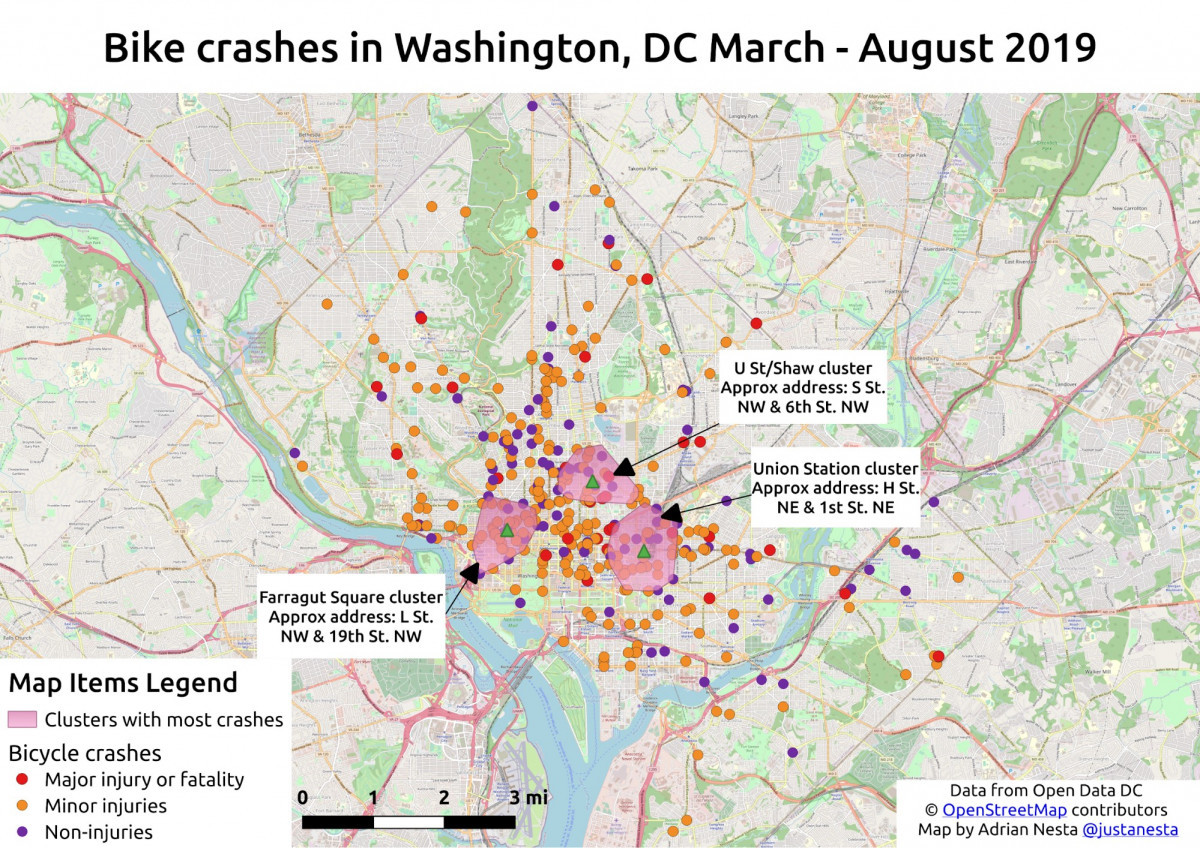
The map of the same time period from 2020 shows not only the aforementioned decline in total bicycle crashes but also how the remaining crashes have clustered in different areas in the city. Bike crashes in this year no longer frequent the Foggy Bottom, Farragut Square, Dupont Circle neighborhoods or the areas around Union Station and NoMa, but rather cluster more frequently in the U St./Shaw and Petworth neighborhoods.
Bicycle crashes by type and neighborhood location in 2020. Image by the author.
Of course, the neighborhood clusters in Wards 2 and 6 encompass most of the downtown business and office spaces, along with the National Mall, surrounding museums, and government agencies.
This would seem to suggest that a lack of commuters to work in greater downtown and tourists around the National Mall have contributed to the drop in bike crashes in these areas, with the larger proportion of fewer crashes instead being centered around more residential areas away from the city center.
As with seemingly most things in modern life it is unclear how prolonged these COVID-19 prompted changes to DC transit habits will be. However, with the main centers of bicycle crashes shifting out of downtown and into more residential neighborhoods, initiatives like Mayor Bowser’s Slow Streets and the broader Vision Zero plan and the Omnibus bill, passed recently by the DC Council, will be even more critical for adapting the region to a new Coronavirus reality.