DC driving citations spike during the early stages of COVID-19

Image by Wayan Vota licensed under Creative Commons.
Five months after Governor Hogan, Governor Northam, and Mayor Bowser’s issuance of stay-at-home orders, it is becoming apparent just how much the pandemic has impacted transportation in the Washington region.
For example, WMATA documented an over 90% reduction in Metro ridership and 70% reduction in MetroBus ridership in the month of April. Uber ridership is down as much as 70% in many metropolitan areas, including DC.
Perhaps more interesting is the data showing drivers’ behavior during this time. With fewer cars on the road, conventional wisdom would say that moving violations would have decreased. But it seems the opposite is true. The number of crashes that have taken place may come as a shock as well.
Here’s a breakdown of moving violations and crashes across the city, including trends and outliers.
Aside from Ward 6, moving violations stayed fairly steady year-over-year February ‘19 to February ‘20. Image by the author.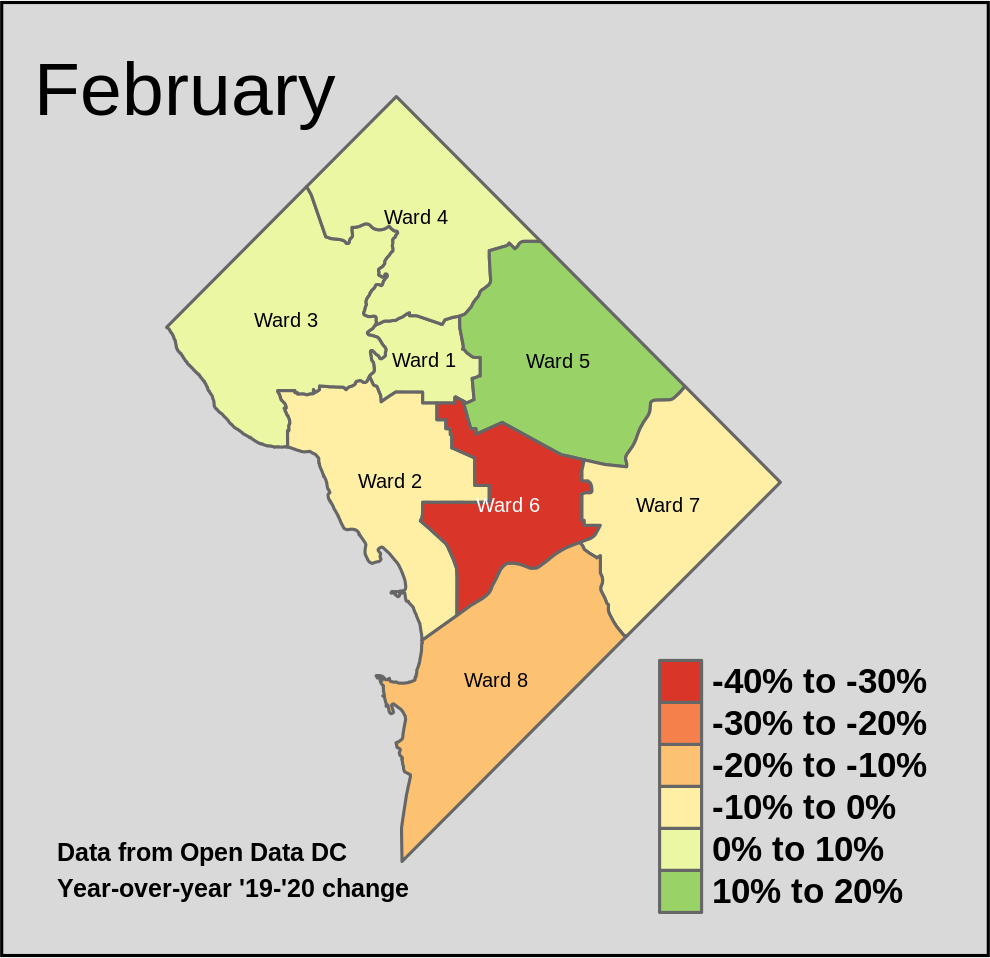
Year-to-year moving violations for vehicles rose 38.1% in March and 17.5% in April, according to the Metro Police Department’s Open Data DC portal. The breakdown of citations by ward gives some insight into where these fluctuations in violations are occurring.
The percentage change in violations comparing February 2019 and February 2020 were pretty stable across all the wards except for an 18.9% increase in Ward 5 and 32.9% and 16.3% decreases in Wards 6 and 8, respectively.
While moving violations declined year-over-year in most Wards from March ‘19 to March ‘20, they were offset by major increases in Wards 6 and 8. Image by the author.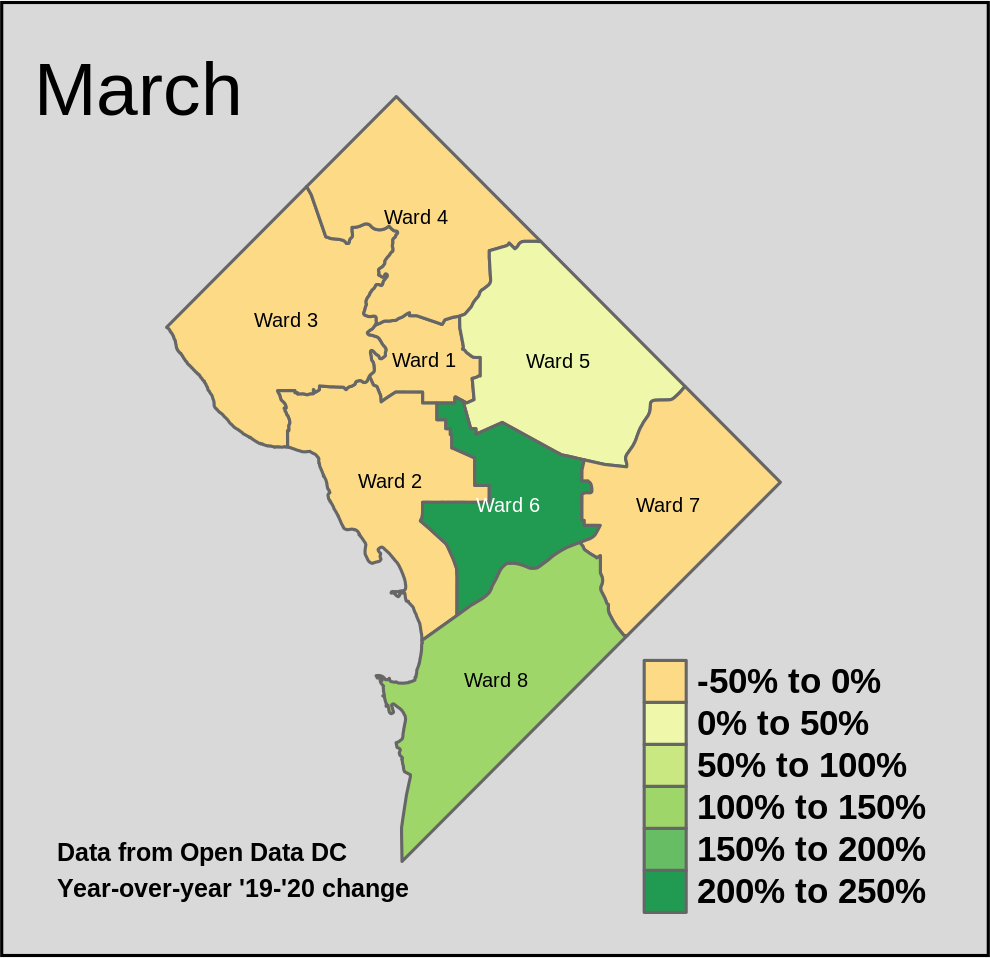
In March, as COVID-related shutdowns started to sweep the city, most wards had either minor increases or decreases over last year. However, Wards 5, 8, and especially Ward 6 saw massive increases over the prior year of 44.3%, 121%, and 219%, respectively.
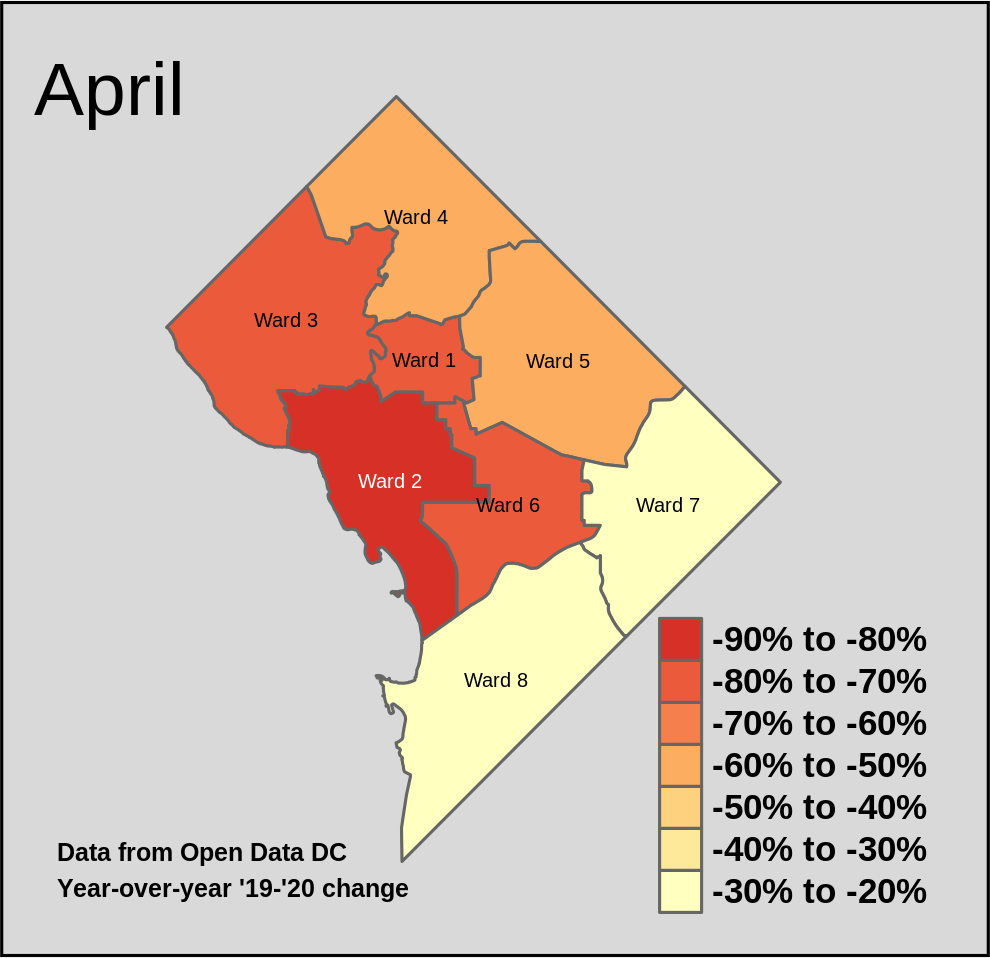
April saw moving violations continue to year-over-year in most Wards from April ‘19 to April ‘20, however they were overshadowed by a significant rise in Ward 8. Image by the author.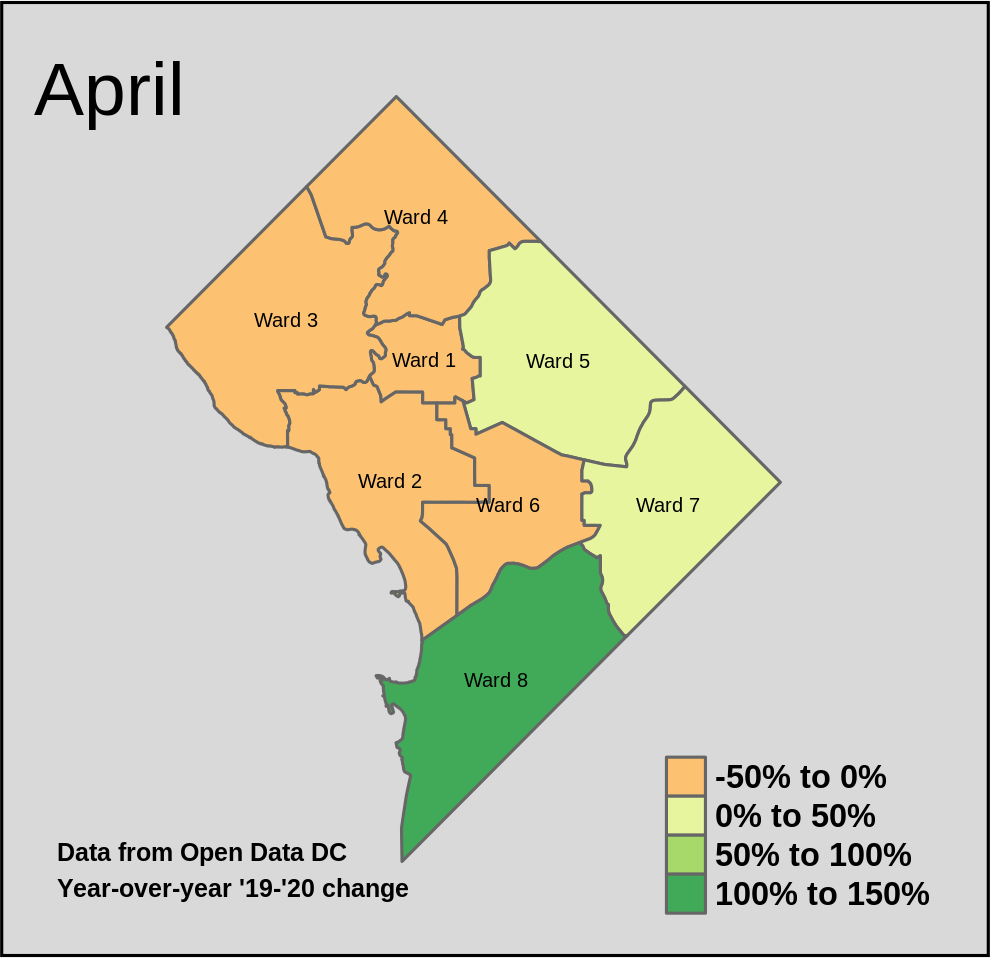
In April, most wards reflected a moderate decline in moving violations. However, Ward 5 and 8 bucked that trend with 26.5% and 129% increases.
The rise of violations in specific wards, notably Ward 6 and Ward 8, were the driving force behind the overall year-over-year rise in both March and April from 2019 to 2020.
By looking at the locations where most violations occurred, it’s clear that DC drivers’ habits began changing in March. The most frequent location of moving violation citations in February through April 2019, as well as February 2020 was 600 Kenilworth Avenue NE, which has the highest revenue producing speed camera in the city.
However in March 2020, the speed camera on I-395 going eastbound after Exit 4 (Maine Avenue by Nats Park) was by far the most frequent location with 27,691 citations. The speed camera at this location alone made up just over 19% of the citations given in March. This camera also recorded twice as many violations as the next most frequent location in any month from February through April in 2019 and 2020.
With 12,937 citations in April, the speed camera on I-295 going southbound about 0.4 miles south of Exit 2 (South Capitol Street/JB Anacostia-Bolling Naval station) recorded the most violations in Ward 8 that month.
The Covid-19 shutdowns changed to the most frequent moving violation location from 600 Kenilworth Ave, NE to the I-395 freeway past exit 4 by Nats Part and I-295 past exit 2 by JBAB Naval Station. Image by the author.
The bulk of violations over the past few months are for speeding — specifically, drivers travelling 11-15 mph over the speed limit on the I-395 and I-295 freeways. Speeding violations in this range increased by 41.1% year-over-year from March 2019 to March 2020, while violations of all speeds increased by 47.4%.
Additionally, 11-15 mph speeding violations rose 15.8% and speeding violations of all rates rose 21.1% between April 2019 and 2020.
Minor speeding offenses of 11-15 mph constituted the bulk of the rise in year-over-year moving violations in March & April from 2019 to 2020. Image by the author.
The overwhelming majority of these speeding tickets are given out by MPD’s Special Operations and Traffic Division via automated speed and red light cameras across town.
The vast majority of moving violations are issued by MPD’s Special Operation & Traffic division, which operate the Districts automated speeding and red-light cameras. Image by the author.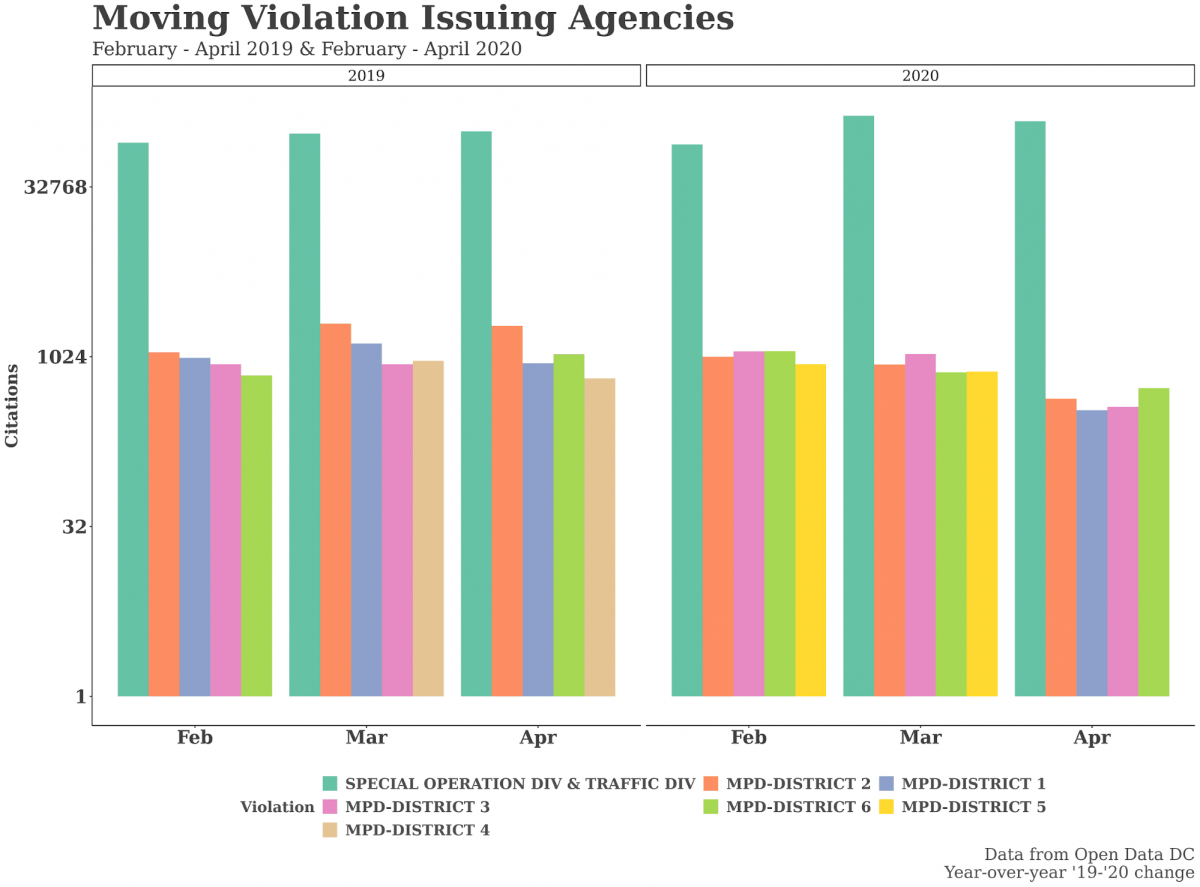
With this rise in vehicle moving violations, one would expect to see a related increase in the number of crashes throughout the District. However, Open Data DC’s dataset of crashes in the city show the exact opposite. While year-over-year crashes increased from February 2019 to February 2020 by about 6%, as stay-at-home orders and social distancing began to take hold in March and April, crashes plummeted by 31% and 61%, respectively.
Combined car, bike, and pedestrian crashes have fallen drastically year-over-year in March and April from ‘19-’20, despite the increase in moving violations. Image by the author.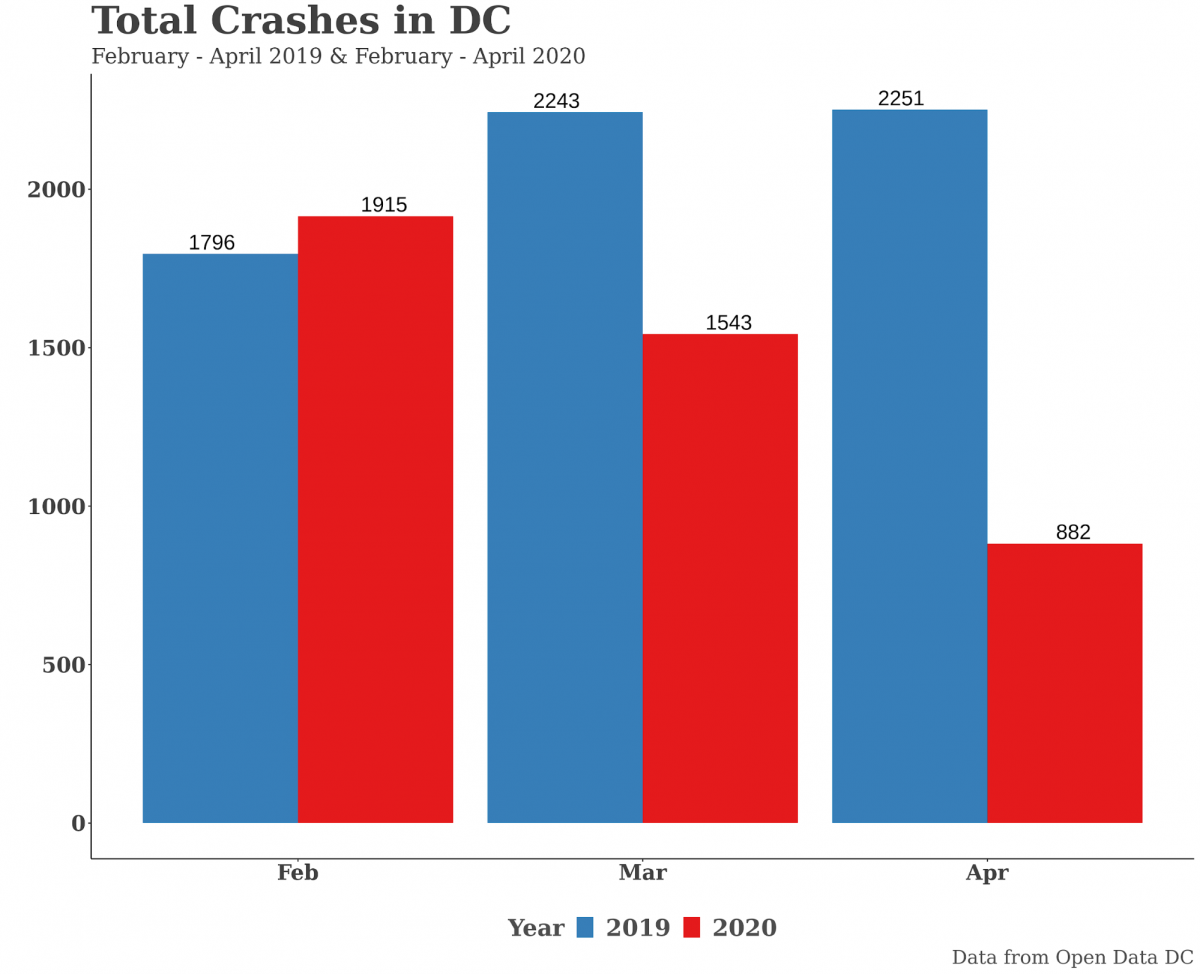
But the distribution of these dips in crashes has not been felt evenly throughout the city. In fact, as the pandemic began to roll through DC in March, Wards 2 and 3 saw between four and five times greater reductions of year-over-year crashes than Wards 7 and 8. This trend only became more pronounced in April when Ward 2 crashes dropped by 86% compared to Ward 7’s 26%.
Declines in year-over-year crashes in March from ‘19-’20 have been much more concentrated in Wards 1, 2, and 3 as opposed to Wards 7 and 8 Image by the author.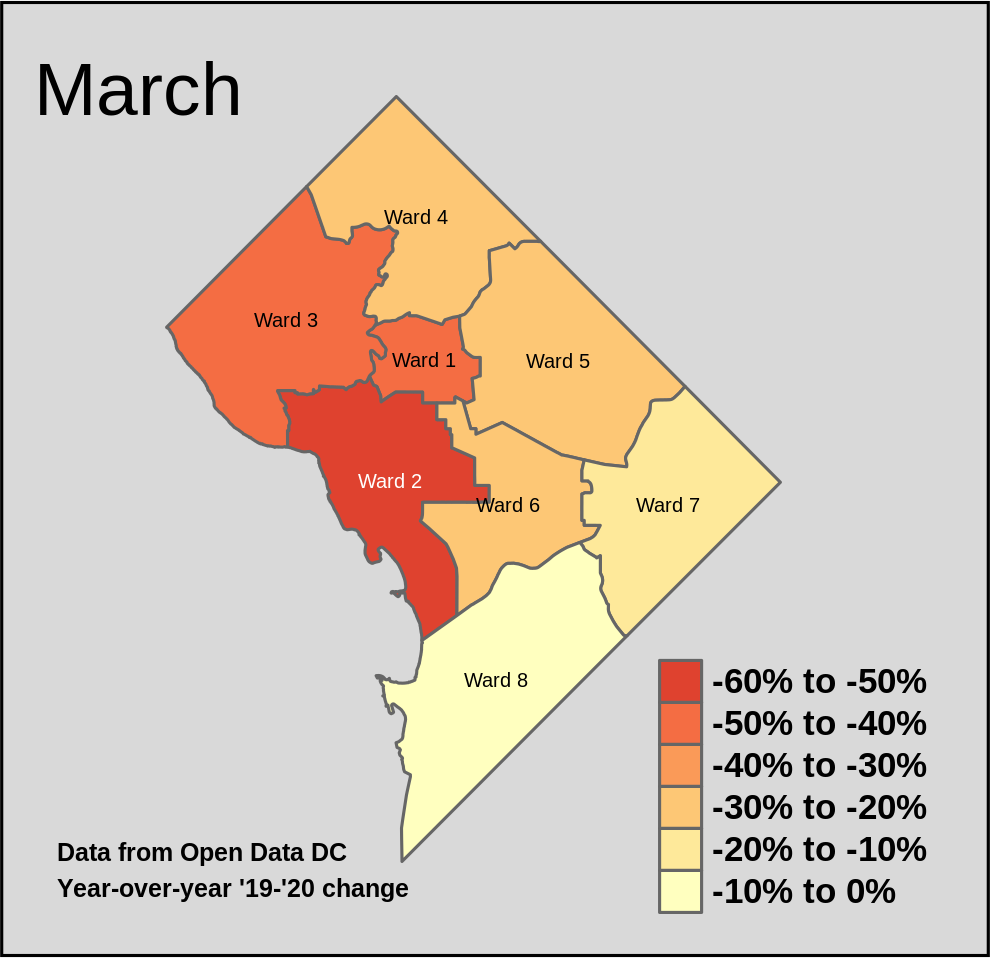
The drop-off in crashes continued in April from ‘19-’20 and only further highlighted the difference between Wards 2 and 3 as opposed to Wards 7 and 8. Image by the author.