Three ways bikeshare can be more equitable in DC

CaBi in Petworth by Bekah Richards licensed under Creative Commons.
This article was first published by the Urban Institute on February 11, 2019.
Bikesharing has gained popularity in US cities as concerns about health, congestion, and climate change have increased. In 2010, the DC Department of Transportation introduced the first city-operated bikesharing system in North America. Since then, Capital Bikeshare users have generated millions of rides, but use and station placement varies around the city.
The DC Department of Transportation clearly considers equity in its bikeshare development plan, and the department used online crowdsourcing to allow residents to vote on new station placement. But is bikesharing reinforcing DC’s existing disparities, or is it effectively acting to reverse them?
To answer this question, we need data. Unlike many privately owned, dockless bike or scooter sharing services, Capital Bikeshare makes anonymized ridership data available online. We focused our analysis only on registered members (who account for three-quarters of the total trips in DC, compared with casual nonmember users) because these riders are more likely to be local residents. View our methodology (PDF) here.
With funding support from the Mastercard Center for Inclusive Growth, we took a closer look at Capital Bikeshare’s potential to address the city’s racial and economic disparities. We placed the 2017 data in the context of DC’s socioeconomic characteristics to identify challenges and opportunities for developing bikeshare equitably. Our analysis revealed two primary challenges.
1. Station placement isn’t equitable and follows patterns of existing infrastructure.
DC has 276 Capital Bikeshare stations, distributed in 118 of 179 census tracts (66% of tracts in DC). The density of bikeshare stations varies across neighborhoods. Census tracts with the most stations are generally near popular destinations for tourists and residents, like the National Mall.
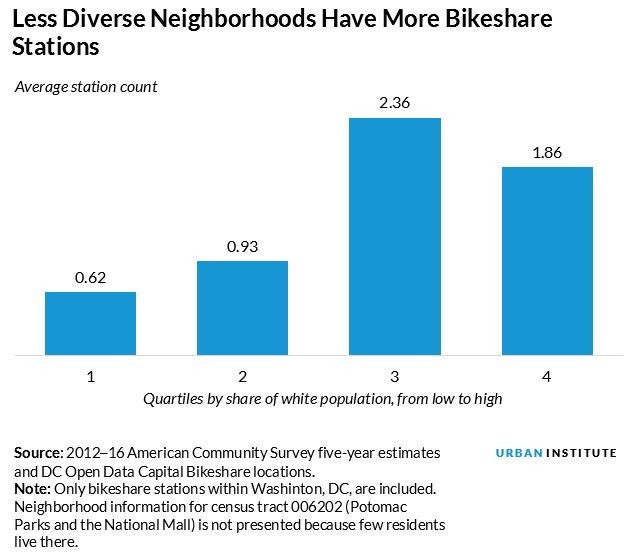
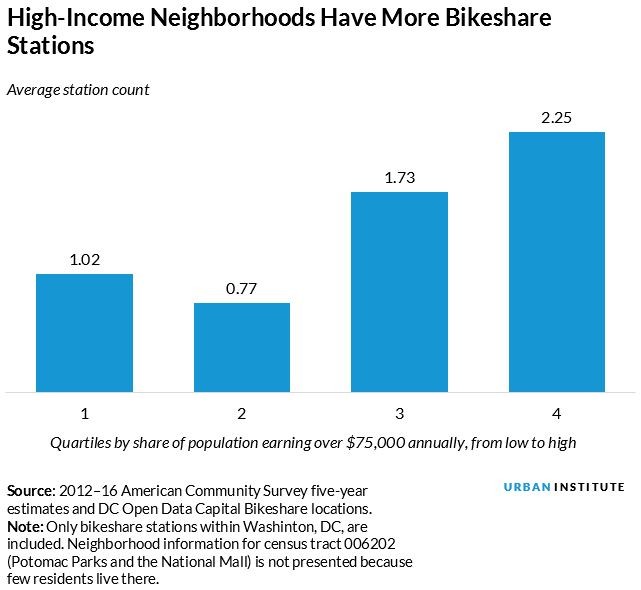
Areas with higher shares of white residents, lower poverty rates, higher income, and higher college attainment tend to have more stations available. On average, tracts in the top quartile in terms of share of white population and income level have more than twice the amount of bike share stations available, compared to tracts in the bottom quartile
Bikeshare station placement generally follows existing transportation infrastructure, such as Metro and Metrobus stations. About 67% of bikeshare stations are located within half a mile of a Metro station, and 99% of bikeshare stations are within a half mile of a Metrobus stop.
Riders also seem to appreciate stations that are closer to a Metro station. Bike stations within a half mile of a Metro station (185 stations) generate 82% of trips, on average.
2. Station use differs by neighborhood.
A single bikeshare station at Union Station saw an impressive 60,371 member rides in 2017, but another station near Capitol Heights (61st Street and Banks PIace NE) generated only 51 member rides.
The most popular centers during noncommute hours are concentrated in neighborhoods that have low unemployment rates, high income levels, more people with a college degree, and fewer people of color. This trend is consistent with findings from a 2016 survey (PDF) that found 80% of bikeshare members are white.
Use is clustered in high-income neighborhoods
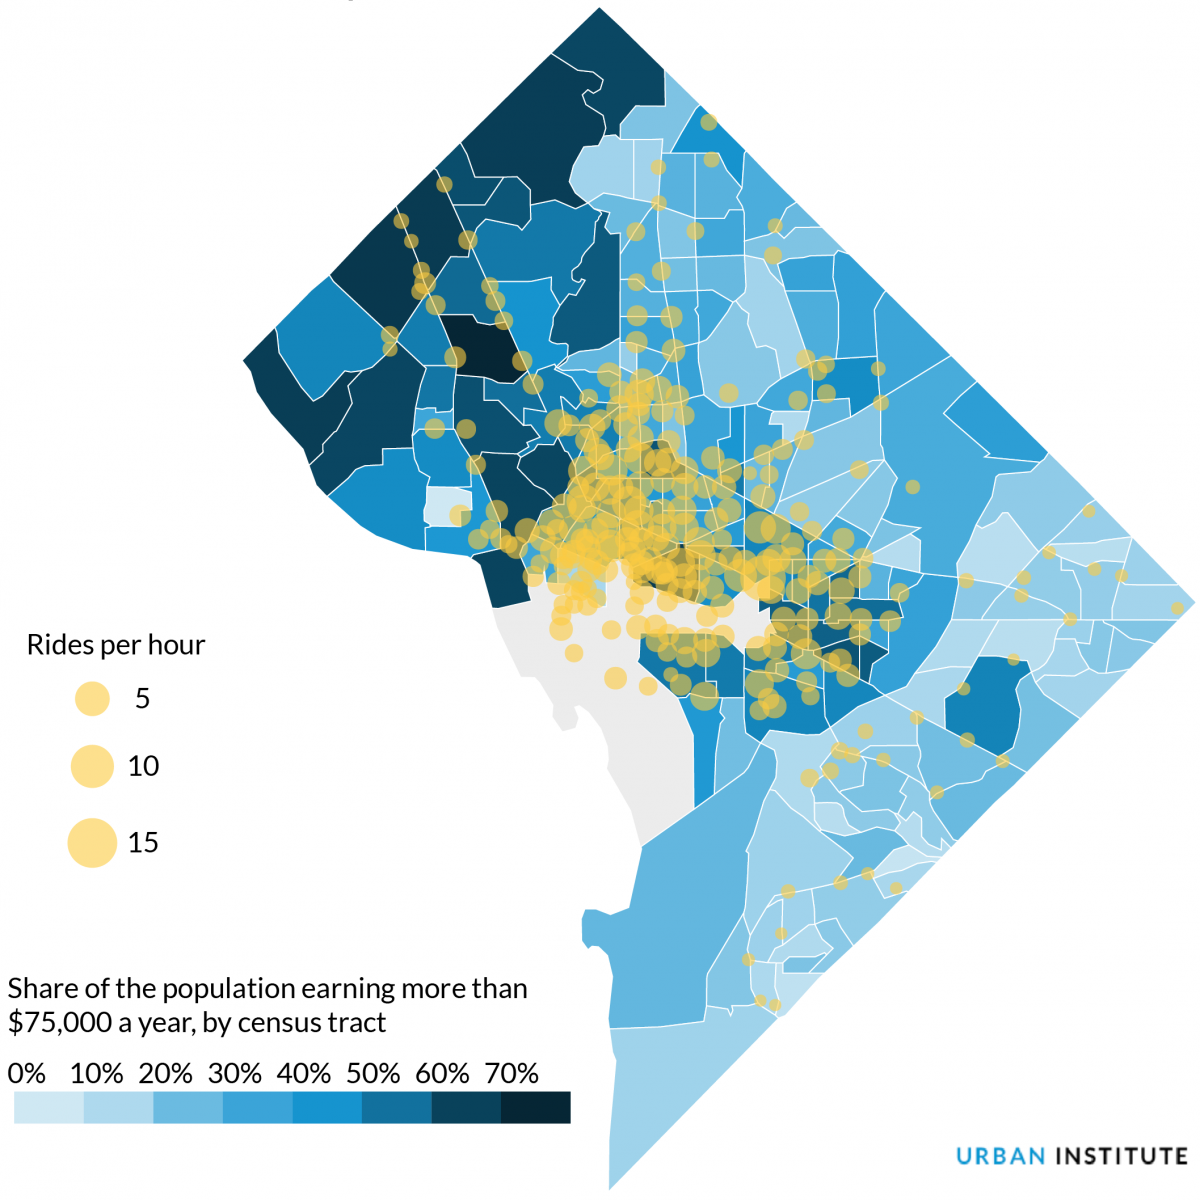
Source: American Community Survey five-year Estimates 2012-2016 and 2017 Capital Bikeshare Trip History Data. Notes: Only bike share stations located in DC are kept in our analysis and maps; as a result, bike trips originating from or traveling to locations outside DC are not included. Neighborhood information for census tract 006202 (Potomac Parks and National Mall) is not presented due to very small numbers of residents living in the area.
Such racial disparity is also reflected by the east-west divide made by the Anacostia River. We grouped DC stations by east and west of the river and looked at bikeshare stations and use, and the equity gap is huge. Wards 7 and 8 (east of the Anacostia river), which are predominately black, accounted for 10% of DC’s total stations, but they generated only 0.5% of the total trips in 2017. While 37% of the trips generated from east of the Anacostia ended up across the river, only 0.1% of trips generated from west of the river ended up east of the Anacostia.
Use is clustered in less diverse neighborhoods
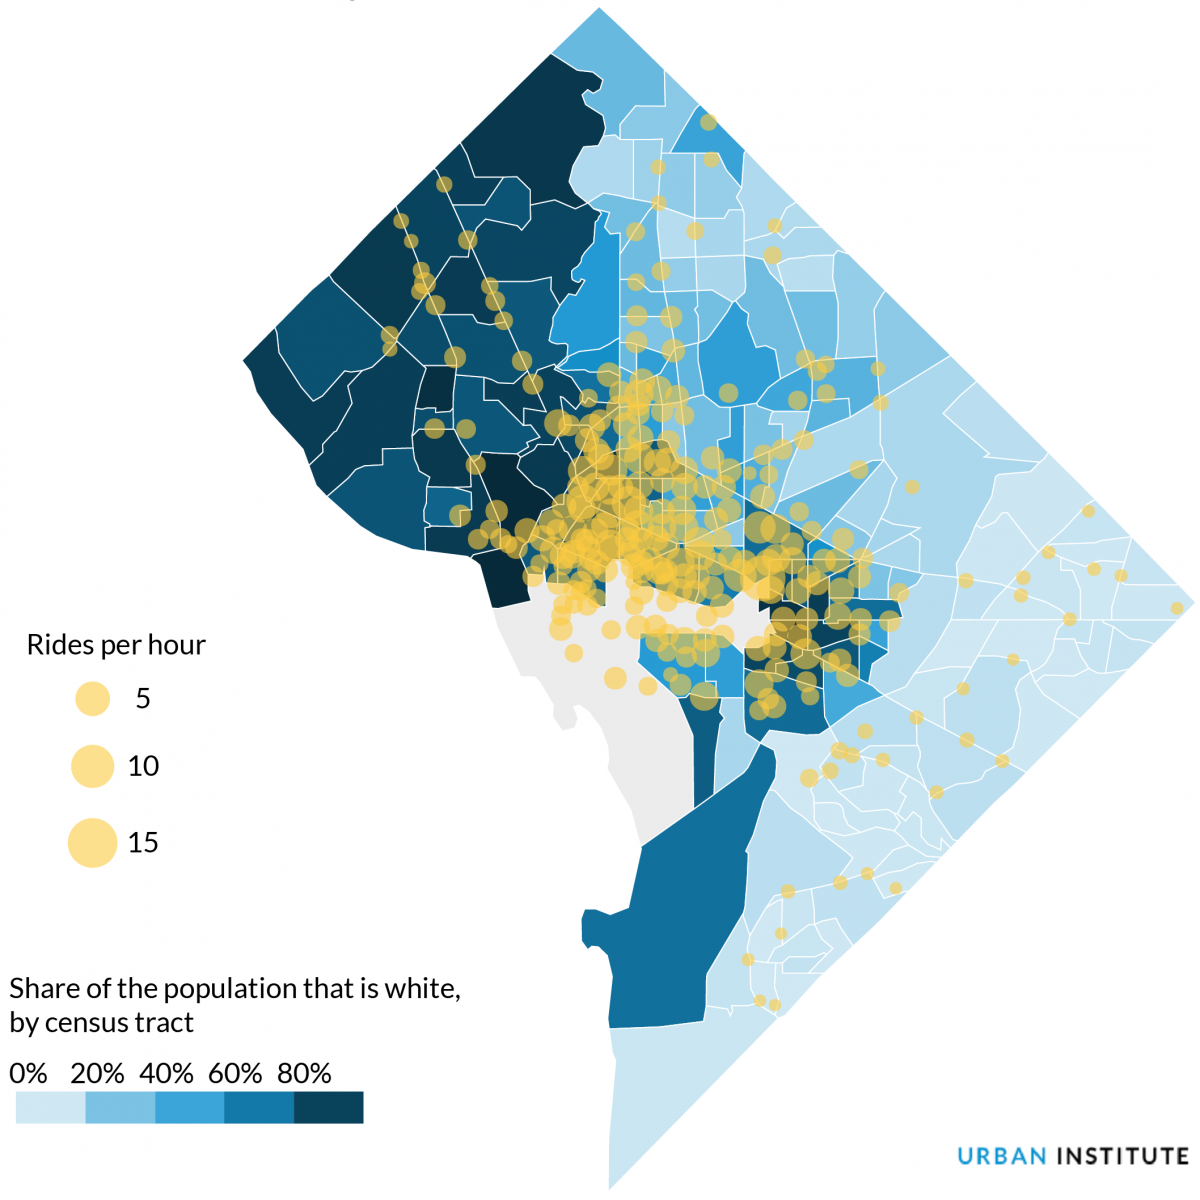
Source: American Community Survey five-year Estimates 2012-2016 and 2017 Capital Bikeshare Trip History Data. Notes: Only bike share stations located in DC are kept in our analysis and maps; as a result, bike trips originating from or traveling to locations outside DC are not included. Neighborhood information for census tract 006202 (Potomac Parks and National Mall) is not presented due to very small numbers of residents living in the area.
These data suggest that people lack incentive to use bikeshare services in these neighborhoods, even when stations are available. The five stations that members used the least in 2017 are all stations added to Wards 7 and 8 toward the end of the year as part of the mayor’s effort to expand DC’s bike network. But even excluding these stations, four of the five least-used stations are still east of the Anacostia.
How can the city use bikeshare service to support its equity goals?
Bikeshare service could improve mobility and connectivity across DC’s racial and socioeconomic boundaries. But our analysis shows that people don’t use bikeshares more just because they are available, raising perhaps the most important question for planners and decisionmakers: what provides incentive for communities to use bikeshares, and what are the barriers diminishing the incentives for certain communities?
Drawing from best practices and studies on potential barriers for accessing bikeshares, here are some ideas policymakers should consider.
1. Promote transparent decisionmaking and access to data.
Capital Bikeshare conducts a user survey every two years that reveals user demographics but doesn’t share individual-level trip data, making it hard to analyze trip patterns by different types of users.
GPS data, also not included in the survey, could show whether certain neighborhoods are attracting trips by revealing routes and speeds through different neighborhoods. More nuanced data should be collected to boost understanding of how people use bikeshare service.
Clarity in the decisionmaking process for future stations could also be a major step toward involving the community and ensuring equitable growth.
Allowing people to vote online for future stations is a good start, but it doesn’t ensure equitable development. Communities that need stations and better overall transportation access often also lack internet access and the ability to weigh in on how new infrastructure is built.
Like New York and Chicago, DC does not specify how stations are selected based on input from locals, so a thorough community engagement plan is crucial for equitable decisionmaking. (Capital Bikeshare is a public-private partnership venture, and DC’s Department of Planning is actively involved in the planning process. View its development plan here.)
2. Develop infrastructure equitably.
Historic disinvestment certainly contributed to the lack of bikeshare use by people of color in low-income neighborhoods. Lack of designated bike lanes in Wards 7 and 8 could also deter people from biking around their neighborhoods.
If public infrastructure like roads, bike lanes, bus stops, and train stations are not evenly developed, Capital Bikeshare will likely only reinforce the existing divides of poverty and economic opportunity.
3. Ease barriers to access for disadvantaged communities.
Underbanked communities also face barriers to accessing bikeshare service. Capital Bikeshare does not provide cash payment options at docks, so users must sign up for memberships online or pay with credit card and make a $100 deposit. Lacking a credit card or a smartphone could be a barrier for some DC residents seeking to integrate bikeshare service into their travel.
Capital Bikeshare already offers financial assistance programs like cash payment options and heavily discounted memberships, but it’s unclear if communities in need are aware of these programs, and data on their success aren’t available.
Philadelphia adopted an innovative program to remove these financial barriers that showed promising results. Communities in the city also had bikeshare ambassadors to promote bikeshare use in underserved areas. In Boston, doctors are “prescribing” heavily subsidized bikeshare memberships to people in communities where bikeshare memberships are unaffordable but whose health could benefit the most from greater use.
DC’s Capital Bikeshare has partnered with more than 30 community groups to offer need-based $5 annual membership. Such programs are promising for serving disadvantaged communities in DC, but better understanding of the demographics of bikeshare users and barriers to to the uptake of reduced-price memberships could help improve outcomes. In an upcoming blog post, we analyze trip destinations and different diversity measures to gather a picture of travel patterns in DC.