Five graphs that show how dockless bikeshare and CaBi work in DC
_800_561_90.jpg)
Lime dockless bicycles by Adam Fagen licensed under Creative Commons.
Over the past year, five dockless bikeshare companies have launched in DC. Four of them are either gone or are pivoting to scooters. But while they were here, how did their operations impact and compare with Capital Bikeshare's? I led a team at Georgetown University that investigated this question.
CaBi provides public data for the approximately 20 million trips taken to date, which served as the foundation of our analysis. For the dockless pilot trips, we collaborated with DDOT to obtain each dockless operator’s trip data from September 2017 through April 2018. The dockless trip data allowed us to see if our CaBi demand model was accurate and to answer some interesting questions DDOT posed about the pilot.
Here are the top five things we learned from our capstone project.
1 - Warmer temperature and US holidays have greatest impact on CaBi trips
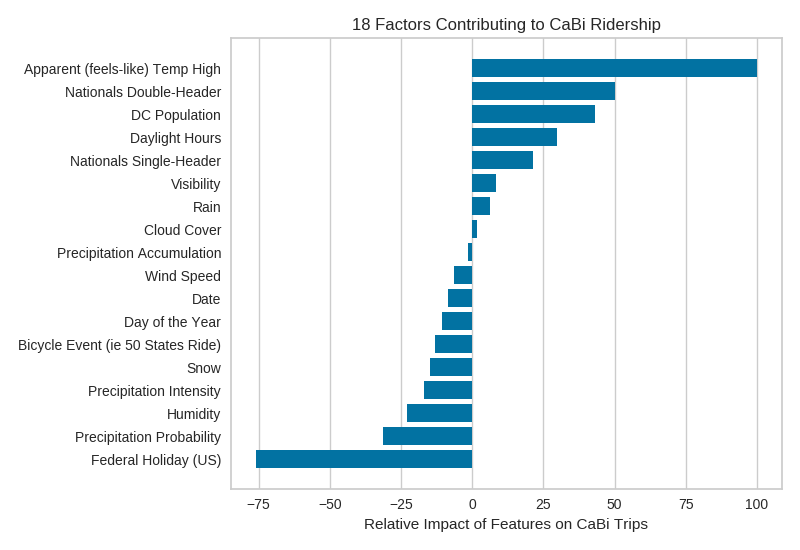
The chart above shows the most important features from our model and whether each feature has a positive or negative impact on daily CaBi demand. For example, DC’s population, which has grown significantly over the eight years that CaBi has been in service, has a strong positive impact on CaBi demand. Conversely, people ride CaBi less if it rains hard.
The features that affect ridership most of all are weather-related. In particular, people ride much more often when it's warm but not humid. Interestingly, ridership declines most when there is a strong threat of rain, but actual rain is not as important.
We found that 80% of CaBi trips are taken by members as part of a daily commute. As a result, US holidays cause CaBi ridership to decrease significantly.
2 - Most dockless bicycles were replaced at an alarming rate
On average, dockless operators are replacing entire fleets more than three times in an eight-month span. The average bike lasted on the street for less than two months. I cannot say for certain why the lifespan of a dockless bike is so short without more operational data from the dockless operators.
In order to calculate the replacement rate, we simply counted all the bikes associated with a dockless operator’s trips in the data they provided. To illustrate this calculation, let’s say an operator placed 400 bikes on the street on average throughout the pilot period. If this operator used 2,600 total bikes during the pilot period, they would have replaced their entire fleet 6.5 times (2600/400 = 6.5).

Capital Bikeshare, on the other had, has only replaced 10% of its bike fleet over an eight-year period, and its bikes last close to 4.5 years on average. CaBi seems to have set the gold standard for bike maintenance for a bikeshare system.
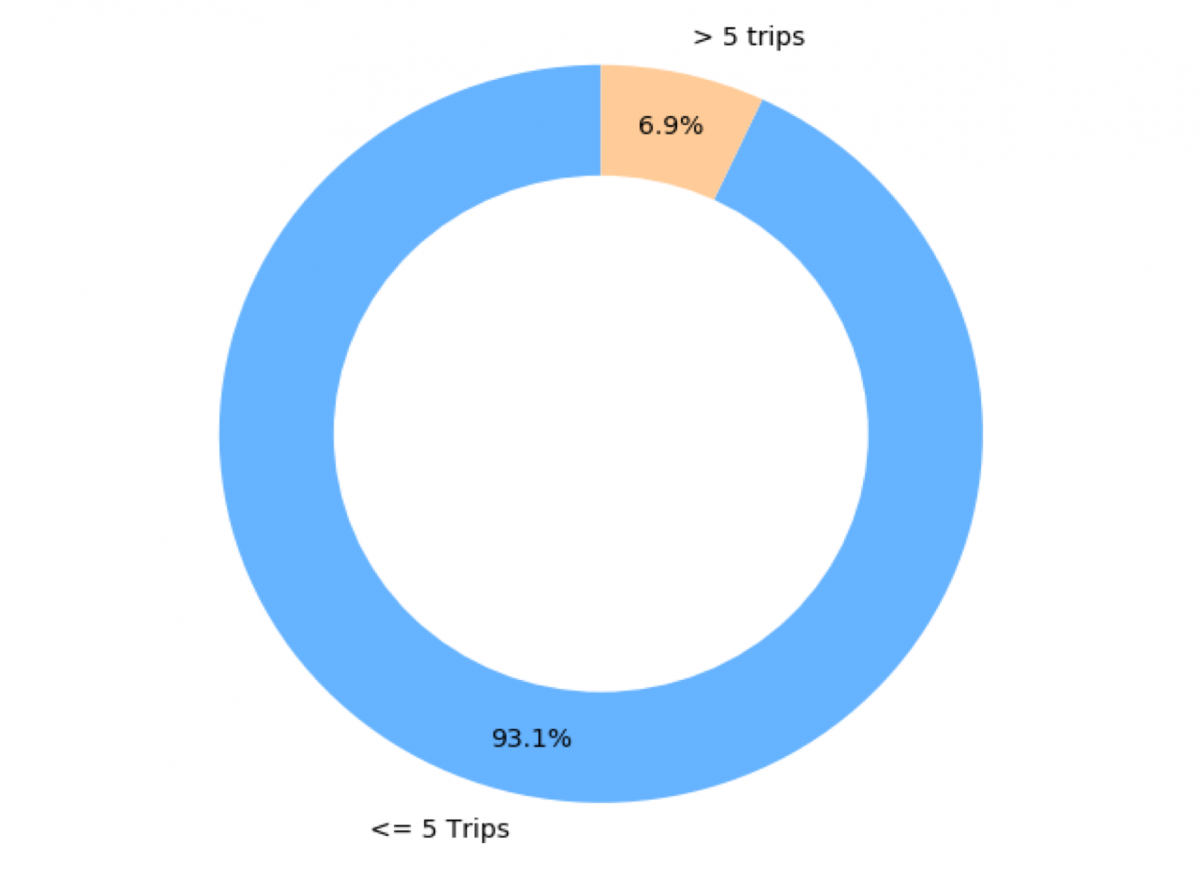
3 - One-off ridership dominated the dockless pilot
A large part of our Capstone project was trying to understand dockless user behavior compared to the two CaBi user groups — members and casual users. It’s important to remember that each dockless operator is capped at 400 bikes during the pilot, while CaBi has more than 4,500 bikes.
Remembering the high dockless bicycle replacement rate, it comes at no surprise that the overwhelming majority of dockless users took five trips or fewer over the dockless pilot period. This statistic tells me that most people are not using dockless bikes for commuting purposes
Digging below the surface of this statistic offers a little more color. These results are a bit deceptive, since there was no way for us to determine how many total dockless trips a user took for all operators combined, only total per operator. It’s perfectly reasonable to assume that users tried out several dockless operators, myself included, which would not be captured here.
We saw two surges of new user activity. The first surge was in late October/early November when all five operators had largely put their full fleets on the streets for the first time. The second surge was in mid-March/early April when Lime introduced scooters. Lime did not differentiate between bikes and scooters, so we had to include scooter data in our analysis.
Given how new the concept of dockless bikes and scooters are to the US market, it’s not surprising that users just wanted to try out the service a few times out of curiosity.
4 - Our model expected more CaBi trips during the dockless pilot period
This figure shows the results of our machine learning model, which is considered to be highly predictive by data science standards. 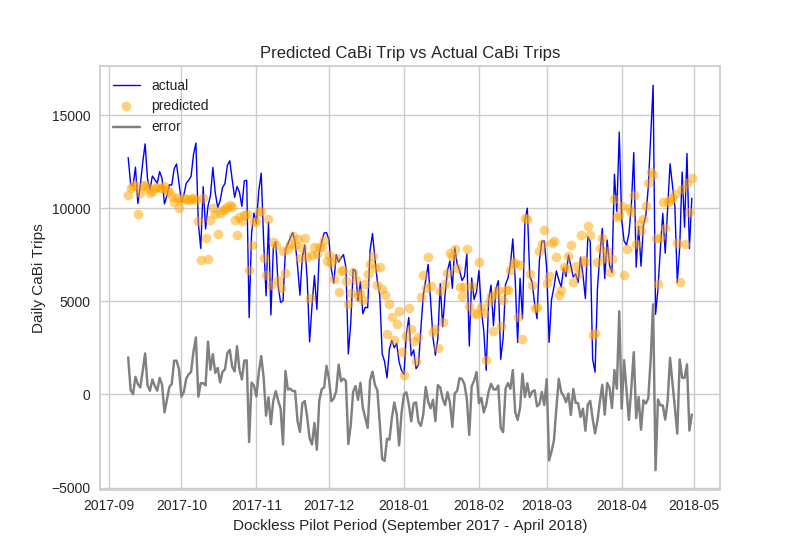
Prior to the start of the dockless pilot, we were able to accurately predict CaBi ridership on a given day based on other data like weather, number of CaBi stations, and whether or not there was a Nationals game. During the pilot period, our model was less predictive — namely, the model expected more CaBi trips than actually occurred.
It’s possible that factors excluded from our model, like dockless trips, could be causing CaBi ridership to be lower than expected. This is what we were trying to prove with this analysis.
On average, the difference between expected and actual CaBi trips is approximately equal to 50% of the dockless trips taken on a given day, so it seems plausible that some of these dockless riders might have otherwise used CaBi. I believe it's likely that dockless bikes did indeed reduce CaBi's ridership somewhat during the dockless pilot period.
5 - 90% of dockless trips overlap with CaBi service area
The map on the left shows that 90% of dockless trips ended within a quarter mile of a CaBi station; the map on the right shows that the remaining 10% of dockless trips ended further away. 
Another way we analyze dockless behavior was geographically. The maps above show the percent of dockless trips over the pilot period by Advisory Neighborhood Commission (ANC) district. The map on the left shows that 90% of dockless trips ended within a quarter mile of a CaBi station.
These trips center on ANC 2A, which encompasses Foggy Bottom and the western part of the National Mall — a further sign of casual dockless usage. A similar CaBi trip map (not shown here) centers on ANC 2C in the heart of downtown DC.
The map on the right shows that the remaining 10% of dockless trips ended further away from a CaBi station. The service area dramatically shifts to Wards 3, 4 and 5, but still has a large concentration in ANC 6D, which is home of attractions like the Tidal Basin and Nationals Park.
Noticeably absent from both maps are trips ending in Wards 7 or 8.
Lessons from our analysis
Based on this analysis, we learned that despite their obvious similarities, DoBi and CaBi are different services with different strengths and weaknesses. Dockless bikeshare may have eaten away a little at CaBi ridership, but not very much if any. That trade-off was some people using bikeshare in areas far from CaBi stations, though most dockless trips overlapped with CaBi service area. Also, DoBi's bicycle replacement rates were genuinely tremendous.
What do you think about our findings?