Where should DC put its affordable housing dollars? Try this interactive tool

Affordable housing in Columbia Heights. Image by ctj71081 licensed under Creative Commons.
The neighborhood you call home has the potential to help your economic mobility and your health and well-being. That’s why it’s important to create more chances for families with low incomes to live in areas that are close to jobs and transit, with low poverty and crime, and high-performing schools.
Yet these neighborhoods are the very areas where it’s most expensive to build affordable housing. The District’s housing resources, while substantial, are nowhere near enough to reach the tens of thousands of families in the city overburdened by high rents.
How do you think DC should prioritize its spending to expand low-income families’ access to a wider range of neighborhoods—and create as much affordable housing as possible?
DC Fiscal Policy Institute has created an interactive tool that lets you explore the balance between neighborhood opportunity measures and the cost of subsidizing housing there. The tool allows you to assign a priority to five measures—neighborhood poverty, violent crime, jobs proximity, racial diversity, and residential land cost—to consider which areas of DC you’d prioritize for affordable housing development. Click here to give the tool a try. Want more information on how the tool works? Scroll down to the bottom of this post.
A screenshot from the tool. Image by the author.
Not surprisingly, this tool shows that some neighborhoods that rank highly on things like job access also rank poorly on cost because they are in parts of DC with the highest land values. But it also shows that the District has a number of neighborhoods with a good balance of high opportunity measures and more moderate land costs.
These four things can indicate neighborhood opportunity
In this tool, we’ve included four indicators that are related to economic opportunity and well-being.
- Poverty rate: Moving to neighborhoods with a lower poverty rate can improve educational attainment, health, and economic well-being. In addition, residents with low incomes who live in low-poverty neighborhoods report less stress.
- Proximity to jobs: Living close to public transit and jobs is especially important to people with low incomes, who tend to rely on public transit and often work service-sector jobs that don’t offer traditional nine-to-five schedule.
- Violent crime: Children who live in neighborhoods with a high rate of violence can face toxic levels of stress that affect their development, including their ability to succeed in school. Living in areas with little exposure to violence can reduce stress and improve school performance.
- Racial diversity: Living in racially diverse neighborhoods provides opportunity for children and adults alike. On the other hand, segregation tends to perpetuate racial inequality.
These variables certainly don’t tell the whole story of a neighborhood—its history, social fabric, or cultural resources—but research shows they are related to economic mobility and well-being.
To be clear, it is just as important to invest in creating opportunities in less advantaged neighborhoods as it is to locate more affordable housing in neighborhoods that already have these opportunities. Historically, low-income and Black neighborhoods have been systematically denied investments such as services, amenities, and wealth-building opportunities through discriminatory policies such as redlining and urban renewal.
Rectifying racial and economic inequality requires both expanding the ability of low-income residents and people of color to access the neighborhoods that wealthy and white residents already have access to, and also rebalancing public investment to support lower income areas.
Here’s how the cost of building housing relates to opportunity measures
The last variable we’ve included in the tool is the residential land cost index, a measure of how expensive it is to buy land and develop housing in different DC neighborhoods.
These maps show how land cost affects opportunity. Image by the author.
The tool allows users to choose their level of priority for each of the four opportunity-related indicators and the land cost index, which then creates an “affordable housing priority score” for each neighborhood based on the selected priorities. You could use the tool, for example, to focus only on land costs, or access to jobs, or on a mix of factors. Adding, removing, or changing the weight of an index changes a neighborhood’s priority score. Whatever you choose, the higher a neighborhood’s score indicates the higher priority the District should place on creating affordable housing there according to your criteria.
There is an obvious tension between a neighborhood’s opportunity indicators and the cost of subsidizing housing there. For example, without considering land cost, areas north of downtown and Capitol Hill look like great places to develop affordable housing. When land cost is taken into account, many neighborhoods in these areas completely drop off the map.
Yet plenty of DC’s neighborhoods retain a high affordable housing priority score once land costs are considered. In particular, there are a number of areas of Ward 5, that have a good balance of access to jobs or transit, relatively low rates of poverty and violent crime, a high level of racial diversity—and relatively low land costs.
This means that by making careful choices, the District can achieve a successful balance, reaching as many households as possible and expanding low-income families’ access to opportunity areas.
How the tool works
When you visit the online tool, you’ll see a map on the left-hand side and five variables with input boxes on the right. Enter a weight in the boxes between 0 and 100 indicating how important each variable is to you. The sum of the five weights should equal 100, but the tool will still return valid results even if you don’t. The weights you select will directly affect the final affordable housing priority index, which dynamically updates with your input and ranges from 0 to 100.
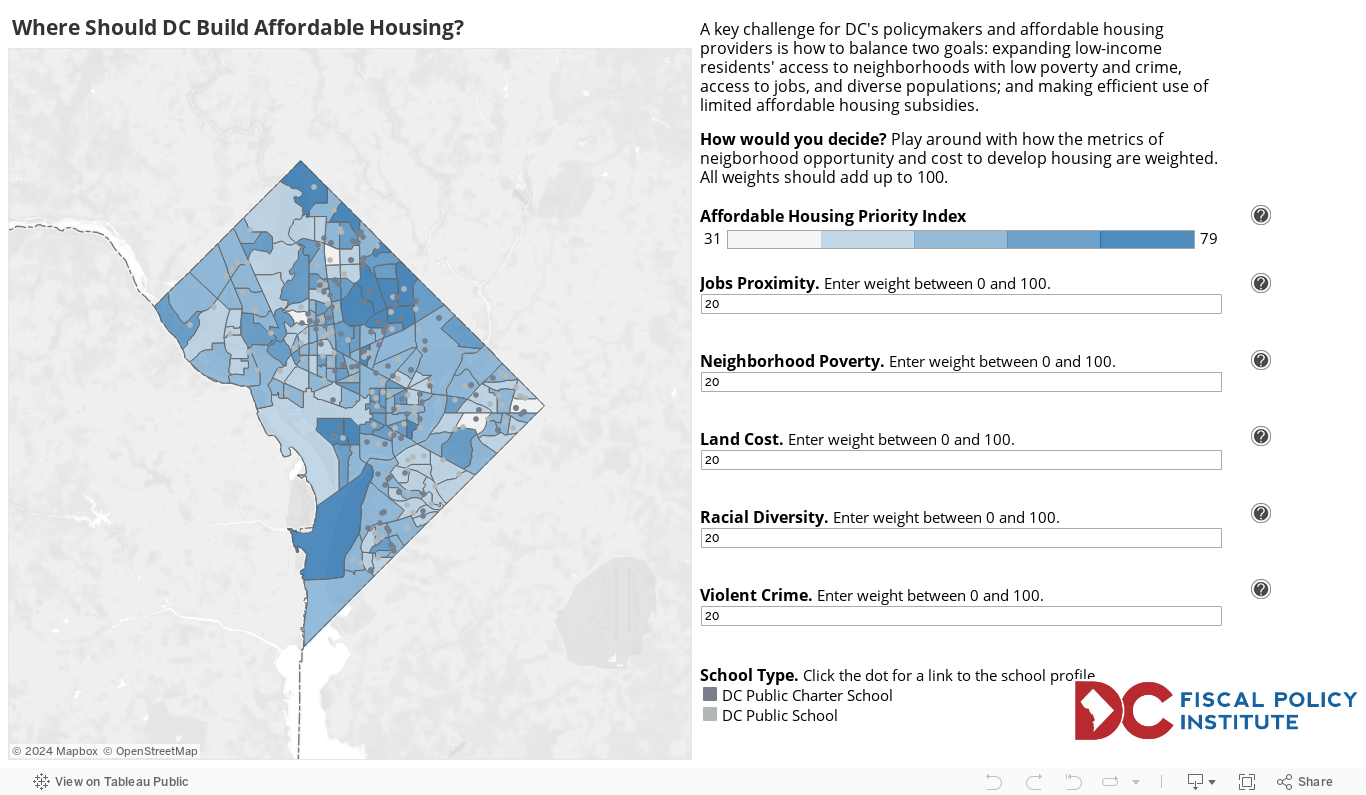
You’ll see the colors of the map change with the affordable housing priority index.The highest-scoring neighborhoods are dark blue—these are where affordable housing development should be prioritized according to your criteria.
If you’d like, click download on the bottom right to save your results. Want more details? Follow this link to view technical documentation on the project.How the tool works
When you visit the online tool, you’ll see a map on the left-hand side and five variables with input boxes on the right. Enter a weight in the boxes between 0 and 100 indicating how important each variable is to you. The sum of the five weights should equal 100, but the tool will still return valid results even if you don’t. The weights you select will directly affect the final affordable housing priority index, which dynamically updates with your input and ranges from 0 to 100.
You’ll see the colors of the map change with the affordable housing priority index.The highest-scoring neighborhoods are dark blue—these are where affordable housing development should be prioritized according to your criteria.
If you’d like, click download on the bottom right to save your results. Want more details? Follow this link to view technical documentation on the project.