How strict land-use rules keep poor people in Mississippi

Image by Peretz Partensky on Flickr.
For much of the 20th century, the US labor market presented unrivaled opportunity for low-income workers to move to greener economic pastures. If the economy sucked in Oklahoma, Colorado, or Mississippi, you could move to California, Connecticut, or New York. Though certain barriers to moving, like racial discrimination, have since lessened, new ones have risen to block low-income Americans’ access to thriving cities.
This is the second in a series of posts on the social and economic costs of unusually strict land-use regulation. You can find the first post here.
According to a recent working paper by economists Peter Ganong and Daniel Shoag, it’s getting harder for low-income and less-educated Americans to move to prosperous places. They find that, on net, these workers are trickling out of expensive cities, and stranded in poorer states. The reason, they argue, is restrictive land-use policies that price lower-wage workers out of economically-vibrant areas. This isn’t just rough for a few individuals in Mississippi and other low-wage states; the authors find that the falling migration rates of lower-income workers might have increased US inequality by as much as 10% over the last three decades.
Let’s back up to Ganong and Shoag’s first observations. During the mid-20th century, average per capita incomes in poorer states grew faster than per capita incomes in richer states, closing the gap in average incomes between the two by about 1.8% per year.
This happened because in the 40s, 50s, and 60s, people migrated from poorer states to richer states. This migration increased the supply of labor in richer states, which caused local wages to rise more slowly. Conversely, cross-state migration decreased labor supply in poorer states, and helped buoy wages and incomes there.
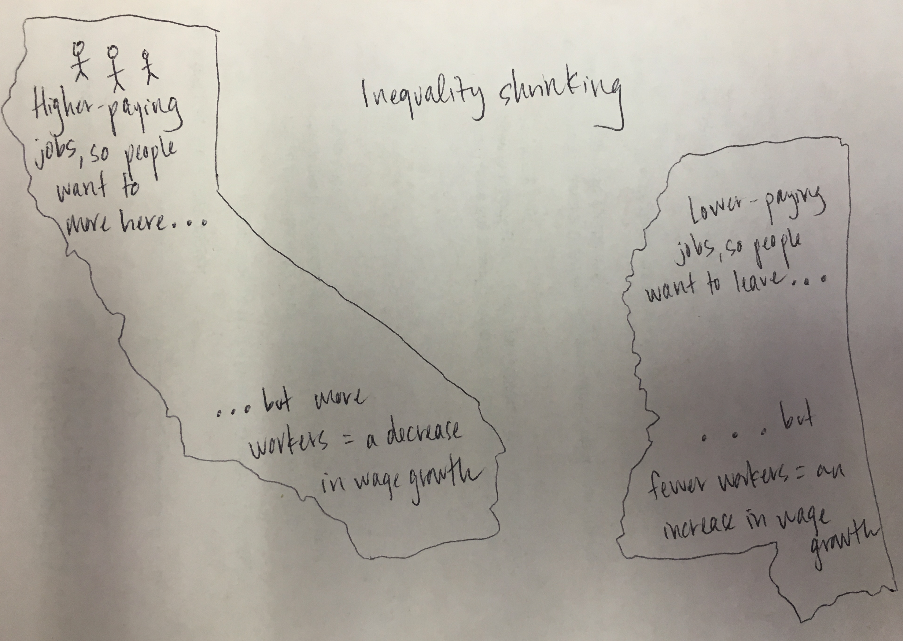
Drawings by Jonathan Neeley.
But something happened in the last few decades. Fewer people were moving from poor to rich states.
The graphs below show the relationship between average state income and state population growth in 1940-1960 (left panel) and 1990-2010 (right).
Let’s look at California in these graphs as an example. In 1940, people in California had high incomes (the state had a high “logged per capita income”). So from 1940-1960, California also had high population growth rate—people moved there to earn those high incomes themselves.
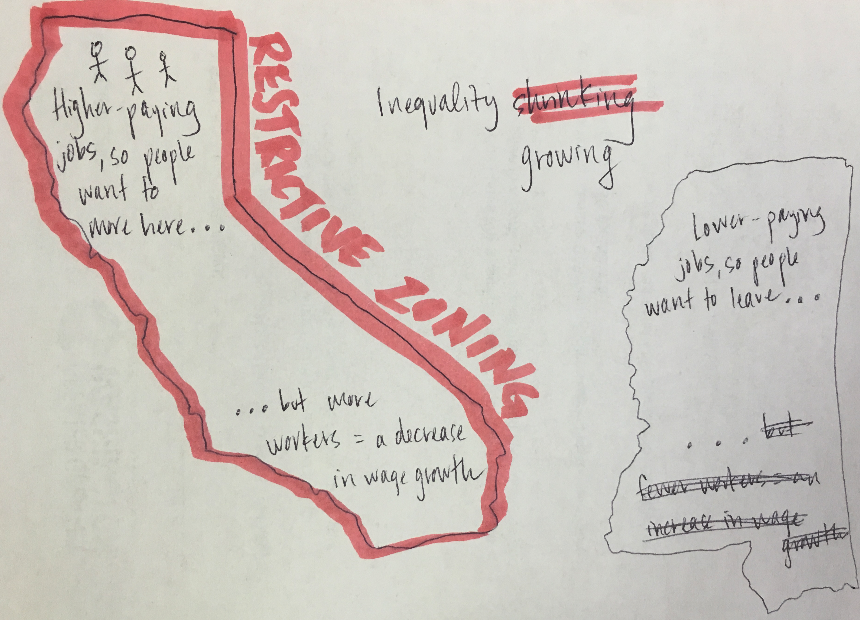
In 1990-2010, people living in California still had high incomes relative to people in other states. But its population growth rate had fallen dramatically—fewer people were moving to California. Why the change? The authors’ argument is that restrictive land-use policies have kept people out.
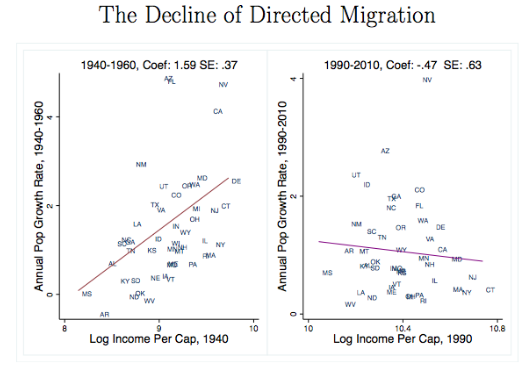
All charts from Ganong and Shoag’s paper.
And, as you might expect, this fall in migration slowed the rate at which incomes in rich and poor states came together. Between 1990 and 2010, income convergence was less than half what the authors observed before; just before the Great Recession, it had slowed to a crawl.
The graphs below show this. The left panel plots the relationship between initial state income in 1940 (“log income per capita”), and state income growth in 1940-1960. As we’d expect, the richer the state was initially, the lower its income growth—because lots of workers moved to those rich states, increasing their labor supplies, which tempered wage growth. Conversely, the lower the state’s starting per capita income, the faster its income grew.
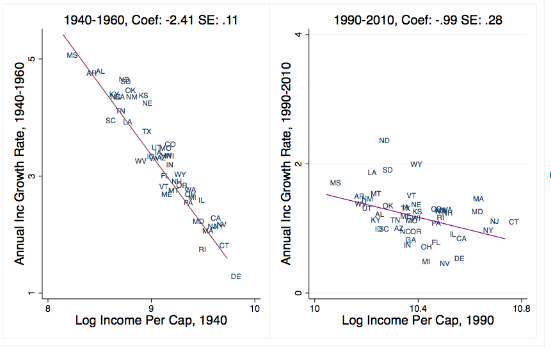
But this stopped happening in the 1990-2010 period, shown in the right panel. Both states that were rich and poor in 1990 experienced similar income growth in the 20 years that followed.
Mississippi is a good example of this. You can see that Mississippians had low incomes in 1940, but per capita income grew rapidly between 1940 and 1960, compared to other states. In other words, Mississippi was part of a broader trend during this period: a shrinking gap between rich and poor states. In 1990, the state still had the lowest per capita income of all states but its income growth rate was relatively worse—posting a growth rate barely better than already-wealthy Massachusetts. The result? More inequality across rich and poor states.
The role of land use regulations
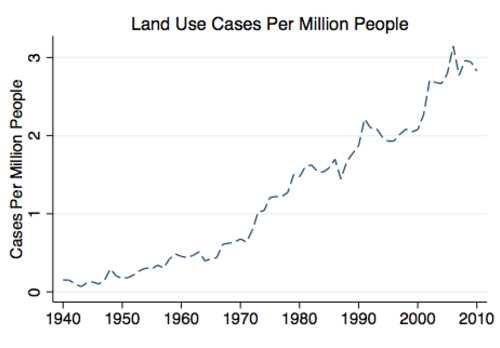
To get at the role of land-use law, the authors created a way to measure how intense a state’s land use regulations are. They track the number of local appeals court records that mention the phrase “land-use,” scaled by the size of each metro. Unsurprisingly, the frequency of mentions has increased over time:
The authors show that, even accounting for the amount of available land, rich metros that developed more-restrictive land-use rules built less new housing, reduced migration among lower-income people, and curbed existing state trends towards per capita income convergence. This not only shunted the poor into low-wage states, it also exacerbated US inequality because the wealthy and educated are still streaming into rich areas. Migration is still worth it to them, as they are able to pay high rents and mortgages. As the authors write,
Had convergence continued apace through 2010, the increase in hourly wage inequality from 1980 to 2010 would have been approximately 10% smaller. The US is increasingly characterized by segregation along economic dimensions, with limited access for most workers to America’s most productive cities and their amenities.
In other words, allowing for more housing (and more affordable housing) in places like suburban Washington could lower US inequality to levels seen in the mid-twentieth century. That seems worth the effort, or at least worth considering.