Walking and transit score high in Virginia’s transportation rankings
Scores that evaluate transportation projects in Virginia recently came out, and many of the highest belong to projects focused on walking and transit. That’s because they provide the most bang for taxpayers’ bucks.
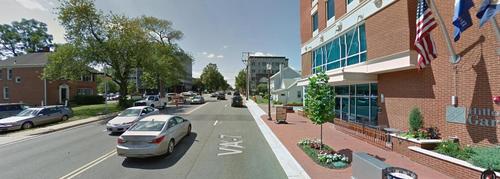
West Broad Street and Oak Street in downtown Falls Church. Image from Google Maps.
In Northern Virginia, projects that focused on improving walking conditions and transit service came out on top in statewide rankings for cost-effectiveness. These included:
- Sidewalk work in downtown Falls Church between Park Avenue and Broad Street (#2 statewide)
- More marketing of transit and carpooling in the I-66/Silver Line corridor (#3)
- Improving crossings at several intersections on Broad Street in downtown Falls Church, including at Oak Street (pictured above) (#8)
Passed in 2014, a state law commonly known as HB2 requires Virginia’s Department of Transportation to use an objective and quantitative system to score transportation projects. The idea is to make planning more transparent, but high score doesn’t guarantee funding nor does a low score preclude it.
In the most recent rankings, 287 transportation projects from across the state received two different scores, one based on the total projected benefit and one based on the benefit divided by the total funding request.
Each of the projects above would cost between $500,000 and $1 million, while most other projects would cost many times that amount. For total project benefits, the addition of High-Occupancy/Toll lanes to I-66 outside the Beltway has the highest score, but it requires a $600 million public investment.
Here’s more detail about the law
Virginia law requires that “congestion relief” be the primary metric in scoring projects in Northern Virginia and Hampton Roads. Scores also account for a project’s environmental impacts, how it fits with local land use plans, and what it might do for economic development.
Three agencies developed the evaluation system: Virginia Department of Transportation, the Office of Intermodal Planning and Investment, the and the Department of Rail and Public Transportation.
The agencies have posted a wealth of data on the HB2 website. You can search for projects in various ways, including by jurisdiction. Data points such as whether or not a project has bicycle facilities, and how it is coordinated with nearby development projects, are posted in an easily navigable format.
What do you think of the analyses? Is there a project in your area that scores higher or lower than you would have expected?