Here’s a map of where people in our region commute to, and how
Commuters in our region mostly travel to work by car, which is the same as the rest of the country. But second to driving, people here use public transportation at higher rates than the national average.

Photo by Kevin Utting on Flickr.
This is according to Who Drives to Work? Commuting by Automobile in the United States: 2013, a report the US Census Bureau published in August based on 2013’s American Community Survey.
The survey gathers demographic and travel to work data from 1 of every 38 households nationwide each year and asks participants how they travel to work. The question asked to determine travel mode to work is “How did this person get to work last week?”
The interactive map below is based on survey results from counties the Census defines as being in the “DC metro region.”
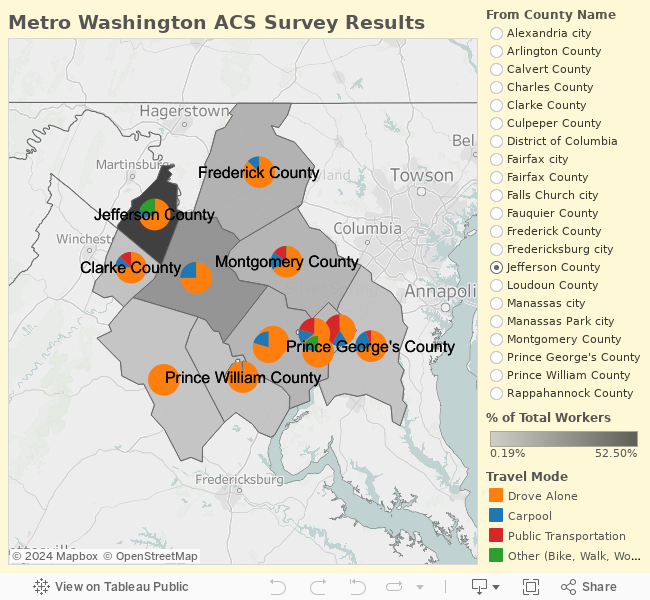
Map by the author.
Here are some things we’ve noticed about our region. Feel free to tell us what you see in the comments below!
For commutes within Arlington County, Alexandria, and DC, “other” is a large chunk of the travel mode. That’s probably an indicator that lots of people in those areas walk or bike to work.
People traveling between Arlington and DC actually use a mode other than driving alone more than half the time.
Commuters from counties located on I-95 South (Spotsylvania County, Fredericksburg City, Stafford County, Prince William County) carpool at rates higher than any others most likely due to the I-95 HOT Lanes.
- In Rappahannock County more than 41% of commuters chose “other.” That distinction includes working from home, and it makes sense that the number in Rappahannock is high since a lot of people there are self-employed and work in the agricultural sector. Other fringe counties like Warren, Clarke, and Jefferson have relatively high “other” mode shares as well.
It’s important to keep in mind that the ACS is a sample survey so there is inevitably sampling error. You can see margins of error for each transit mode by hovering over the data. In general data from more populous counties will be more reliable.
Lots of people drive in our region, but not as much as other places
Among the biggest takeaways from the report is that DC has some of the highest commuting rates in the country. In other words, a whole lot of people travel to a county outside of the one they live in to get to work.
But our region ranks eighth-lowest among places where people drive to work, with 75.7% of commuters doing so compared to the national average of 85.8%. Of the remaining DC commuters, 8% choose Metro. The national average for all public transit use is 5.2%.
The list of lowest auto use is led by New York City with 56.9%, followed by Ithaca, NY with 68.7% and the Bay Area rounds out third at 69.8%. New York City is certainly unsurprising, Ithaca has a big college population that mostly walks, and in the Bay, the well developed bus and trolley bus network is a popular mode for commuters.
According to the report, the rate of driving to work alone or with others, on the rise since 1960, peaked in the year 2000 at 87.9% before dropping to the current rate. The list of cities with the biggest drops in auto use since 2006 were in the San Francisco Bay Area, Boston, and Durham-Chapel Hill. Our region did not make it on the top 15 in that category.