When governments make road data public, anyone can help make roads safer
This map shows where people have been caught speeding in Montgomery County this summer. If DC and other local jurisdictions released more open data, we could make maps like this for places all over the region.
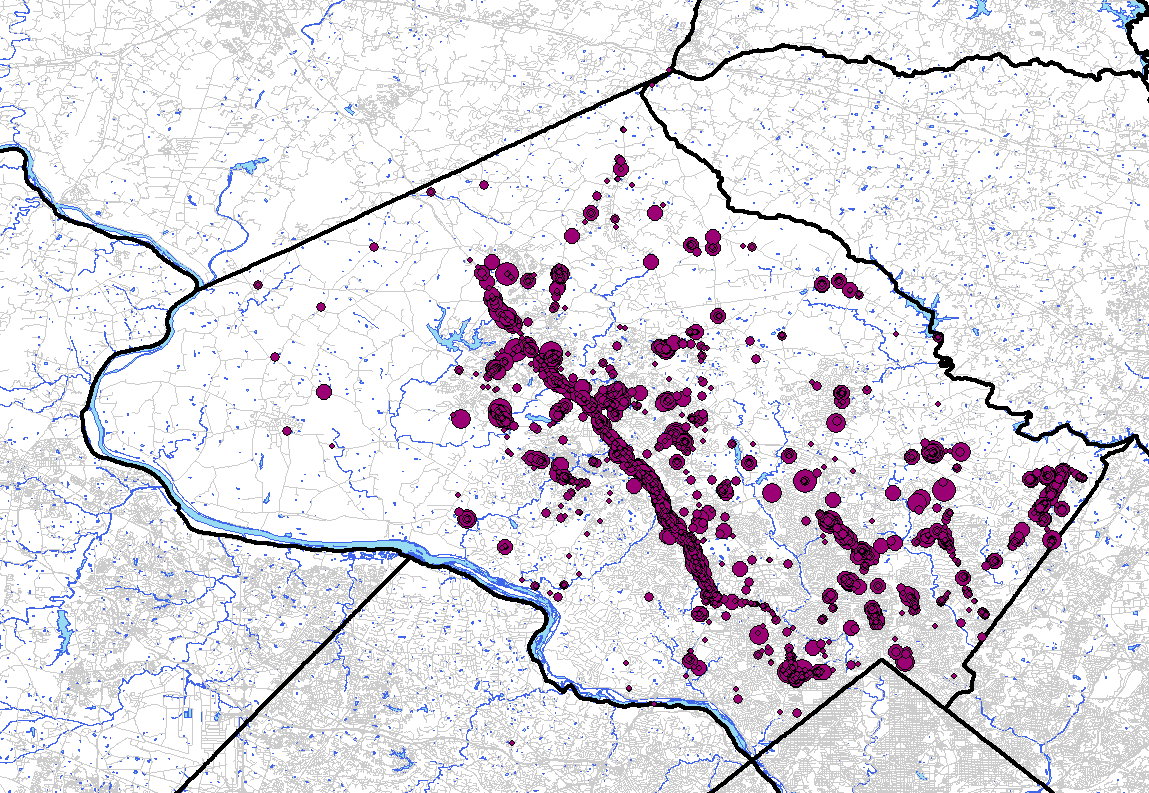
Speeding citations in Montgomery County and how much each was exceeding the legal limit. Map by the author.
Montgomery County now publishes detailed traffic violation data, which goes online daily here. This data allows anyone to see where and when the police are issuing citations, and to whom.
The map covers the period from June 1st to August 16th in Montgomery County. The bigger the bubble, the more the driver was over the speed limit and the bigger their violation.
What is open data and why is it useful?
The data I used to make the map is a good example of local jurisdictions providing open transportation-related data. Open data is data that is readily accessible and manipulable by anyone who wishes to use it in whatever way they wish to do so.
Making the large amounts of government data more available allows people to more easily participate in government. In terms of transportation, open data can allow residents to identify traffic patterns and safety problems.
We’re making progress with open data, but there’s a ways to go
Our region has made good strides in recent years to make government data more accessible to the public, including some transportation data. This has led to people developing innovations like CaBi Tracker.
After months of internal meeting, DDOT recently kicked off the public portion of its Vision Zero initiative. This effort includes an innovative crowdsourcing effort to map dangerous streets and intersections. (If you haven’t contributed, you can do so here.)
DDOT has gone a step further and posted this data in an open data format online. This allows anyone to download and manipulate the data to understand what people have said about transportation safety throughout the District.
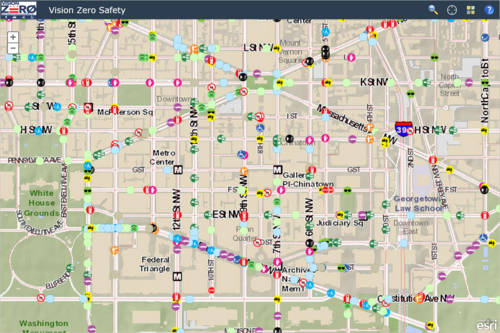
DDOT made its Vision Zero Map data open. Image from DC Open Data.
On the other hand, apart from Montgomery County, no jurisdiction posts violation data or sidewalk closure data and few post crash data.
In DC specifically, the crash data that’s available isn’t very useful when it comes to analysis. For example, this crash statistics report that came out in March 2014 covers crashes that happened between 2010 and 2012, meaning it took some crashes four years to show up in a public form. The District will release the actual data used to write the report, but it’s not easy or obvious how to get it. To improve things, DC’s Vision Zero effort includes making transportation data more open, although it is not yet clear when or how this will happen.
At present, though, the District’s open data on 311 calls (which is excellent) means that it’s easier to find out the location of roadkill than it is to find where people have been hit (see map below).
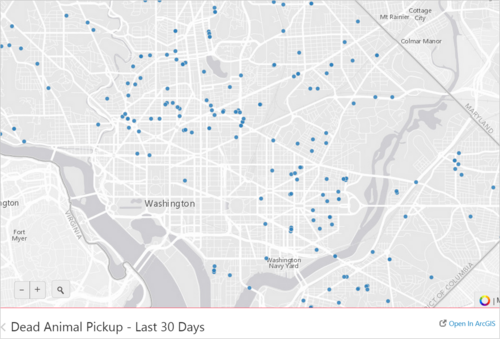
DC currently provides better data on roadkill than crashes with humans. Image from DC Open Data.
Improving this situation would cost little but do a lot to improve services and accountability for our region’s residents.
Building on my map, for example, more data from Montgomery could enable someone to compare citations to speed gun surveys and collision data, to see if speeding enforcement is matching the location of speeding and crashes. More data could also be used to help identify places where design changes or automated enforcement could be considered to alleviate the number of police officers required to enforce speeding laws.
With ever more jurisdictions making serious commitments to improving street safety, now is the time to make more transportation data open to the public.