Three maps that illustrate the connection between poverty and low test scores
These 3 maps show where poor kids live in DC, and how students in each neighborhood score on standardized tests in reading and math. They’re a vivid illustration of the connection between poverty and low test scores.
DC Action for Children, with support from the Annie E. Casey Foundation, recently worked with a team of volunteers to create the DC Kids Count data tool, an interactive visualization of child well-being in the District.
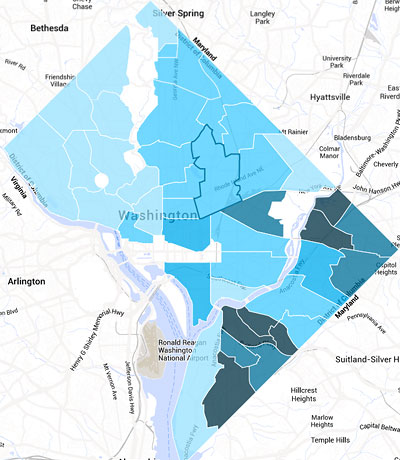
Percentage of children in poverty.
One part of the data tool is the map above, which shows child poverty rates in various DC neighborhoods. The rate is based on the estimated number of children under 17 who live below the federal poverty line in a given neighborhood, divided by the total number of children in that age group who live there. The greater the rate of child poverty in a neighborhood, the darker the shading on the map.
On all 3 maps, the dots represent locations of public schools. Blue dots are traditional DC public schools, while red dots are public charter schools.
The two maps below show student proficiency rates on DC’s standardized tests, the DC-CAS. Students who score above a certain percentage on the tests are labeled proficient or advanced. Those who score below that percentage are categorized as basic or below basic.
Usually, proficiency rates are tied to individual schools, but the maps below link them to where students live. That can make a significant difference in DC, where only 25% of students attend their neighborhood school.
DC Action for Children decided to use neighborhood-level proficiency rates because we wanted to make a connection between the resources available to children in their neighborhoods and their performance on tests.
The maps show math and reading proficiency rates based on the 2013 DC-CAS results. They reflect aggregated scores for all students in a given neighborhood, including all tested grade levels and those who attend charter schools as well as DC Public Schools. The higher the rate of proficiency, the darker the neighborhood is shaded.
For math:
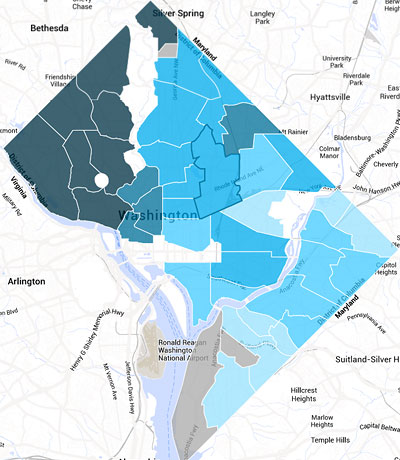
Percentage of students proficient in math.
For reading:
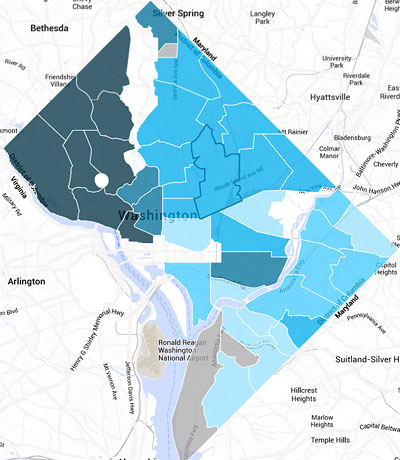
Percentage of students proficient in reading.
Taken together, the maps show that on average, the higher the child poverty rate in a neighborhood, the lower the percentage of students who are proficient in math and reading. Notably, the median poverty rate was 52% for the 10 neighborhoods with the lowest percentage of students who are proficient in reading.
Pictures like these require DC residents to ask tough questions about how we allocate our resources and how we can ensure that all children have access to high-quality education.