How school tiers match up with Walk Score
One of the best effects of open data is when people correlate data sets from very different places to generate interesting information. This graph cleverly combines DC’s school quality tiers (known as “accountability categories”) with Walk Score:
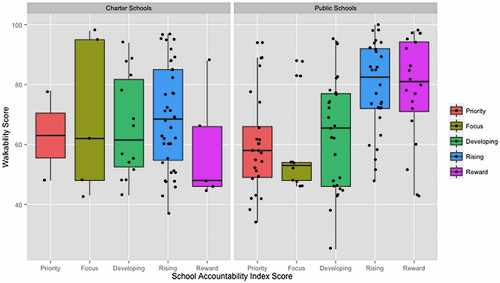
Sandra Moscoso wrote yesterday about how Code for DC’s School Decisions Project has been gathering coders who want to use open data to help parents, students, and policymakers. This is one of the graphs they created at the recent Open Data Day using data from the Office of State Superintendent of Eduaction (OSSE).
I’ve asked to get access to the raw spreadsheet for this graph so we can look at, for example, which schools each dot represents. Here are the accountability categories by school. I will add the spreadsheet with WalkScore matched up with category when it’s available. Update: here’s the data as a CSV file.
A few things immediately jump out. The most successful DCPS schools have high Walk Scores, while the least successful ones mostly (but not entirely) cluster in the lower range. This may reflect the fact that a public school’s success has a lot to do with the socioeconomic status of the neighborhood, and the local retail that is a big part of Walk Score locates in areas with higher incomes.
That income effect is also very pronounced in the graph Sandra posted yesterday:

That’s not the case with charter schools. 3 of the 5 “reward” charters are in low-Walk Score areas (which could mean something, or just be a consequence of little data), while the “Rising” charters are basically all over the place. This may have a lot to do with the simple fact that since charters have to find and pay for their own space, they’re in all manner of locations.
An interesting future step might be to correlate the school tiers with some data set about land prices or rents, or resident incomes. That could help illuminate whether charters end up locating in less-expensive areas, because they want to serve poorer residents and/or because they need cheaper land.
What do you see from looking at this data?