Redistricting Game results, part 5: The best options
How should the DC Council redraw DC’s wards? Based on the results of the Redistricting Game, one of these two ways:
In past parts, we discussed fun maps, what residents of each area want, how much to change the wards, and what changes appeared on the most maps. We determined that by and large respondents prefer making more minor changes, modifying few areas even if it means the wards don’t end up equal in population.
Therefore, the key questions are: What are those minimal paths to satisfy the redistricting rules, and which ones will make people happiest?
This table shows the key information we need to make that decision. It lists the areas that the highest percentage of maps moved into Ward 8, into Ward 7, or out of Ward 2, plus a few others also with high percentages of maps moving each one.
| Area (Census Tract) | Pop. | From Ward | To Ward | All | Res. | Losing Ward | Gaining Ward | Area Res. |
|---|---|---|---|---|---|---|---|---|
| Fairlawn S. (76.05) | 3,031 | 7 | 8 | 57% | 61% | 46% | 52% | 3/6: 50% |
| Fort McNair (110) | 3,715 | 6 | 8 | 24% | 23% | 19% | 21% | 3/64: 5% |
| Buzzard Point (64) | 2,139 | 6 | 8 | 18% | 16% | 12% | 21% | 3/16: 19% |
| Hill East (68.04) | 3,670 | 6 | 7 | 54% | 53% | 45% | 58% | 0/4: 0% |
| Anacostia Park (111) | 0 | 5 | 7 | 39% | 41% | 40% | 31% | N/A |
| Arboretum (111) | 568 | 5 | 7 | 27% | 28% | 25% | 22% | 1/4: 25% |
| Langston (89.04) | 3,309 | 5 | 7 | 25% | 26% | 28% | 17% | 0/3: 0% |
| Fort Lincoln (90) | 2,732 | 5 | 7 | 22% | 23% | 18% | 20% | 1/4: 25% |
| Fairlawn N. (76.01) | 4,355 | 8 | 7 | 12% | 11% | 21% | 14% | 4/12: 33% |
| Carver (89.03) | 2,633 | 5 | 7 | 10% | 10% | 9% | 6% | 0/3: 0% |
| Rosedale (79.01) | 3,822 | 6 | 7 | 8% | 8% | 8% | 3% | 0/3: 0% |
| Langdon/Gtwy. (111) | 2,996 | 5 | 7 | 7% | 7% | 8% | 9% | 1/3: 33% |
| Gallery Place (58) | 598 | 2 | 6 | 38% | 37% | 37% | 39% | 2/6: 33% |
| Mt. Vernon Sq. (48.02) | 2,817 | 2 | 6 | 30% | 29% | 30% | 25% | 17/75: 23% |
| 15&T (43) | 1,294 | 2 | 1 | 28% | 30% | 30% | 41% | 11/44: 25% |
| Shaw (48.01) | 2,113 | 2 | 5 | 22% | 23% | 22% | 24% | 7/70: 10% |
| Downtown (58) | 386 | 2 | 6 | 18% | 17% | 17% | 18% | 1/5: 20% |
| 17&T (42.01) | 2,537 | 2 | 1 | 16% | 16% | 14% | 20% | 18/58: 31% |
| Burleith (3) | 2,235 | 2 | 3 | 13% | 13% | 13% | 18% | 9/52: 17% |
| Mt. Vernon Sq (48.02) | 2,817 | 2 | 5 | 11% | 12% | 11% | 13% | 6/75: 8% |
| “Chimney” (46/48.02) | 309 | 6 | 5 | 8% | 8% | 11% | 9% | 4/10: 40% |
| Riggs Park S. (95.07) | 1,489 | 4 | 5 | 22% | 22% | 20% | 19% | 0/3: 0% |
| Howard U (34) | 4,086 | 1 | 5 | 12% | 13% | 14% | 20% | 5/38: 13% |
| Kingman Park (79.03) | 1,774 | 7 | 6 | 12% | 13% | 35% | 15% | 34/38: 89% |
The percentage labeled “All” is the percentage of all maps that moved this area between the two specified wards. “Res.” is the percentage of DC residents that moved it. “Losing Ward” is the percentage of people in the ward it would leave, and “Gaining Ward” the percentage of people in the ward it would go to. Finally, “Area Res.” shows how many people who said they live in that particular area moved their own area between the two wards.
For example, take Ward 7 part of Census Tract 76.05, which covers the southern part of the Fairlawn neighborhood. As we discussed before, a plurality of residents chose to move, and a majority of overall maps showed it moving.
57% of all maps, 61% of DC resident maps, 46% of Ward 7 maps, and 52% of Ward 8 maps including moving this area, and 3 of the 6 residents who filled out maps likewise moved it (2 others kept it in Ward 7 and one moved it to 6).
Based on this, it’s a clear choice to move this area into Ward 8. Fortunately, it has enough people that Ward 8 then exceeds the required minimum; not only that, it actually puts Ward 8 near the average for all wards.
What about the other options, like crossing the river as Marion Barry has suggested? The other two top choices are Census Tract 110 (Fort McNair) and 64 (Buzzard Point), both with around 20% of maps moving each. This is so much less popular, even with Ward 8 residents themselves, and very unpopular with residents of those particular areas.
Next, let’s look at Ward 7. There is another clear top choice among map makers generally: the southern half of Census Tract 68.04, Hill East area. 54% of all respondents, 53% of residents, 45% of Ward 6 residents, and 52% of Ward 7 residents chose to move into Ward 7. Moving this area would also bring Ward 7 into compliance.
It’s not quite as much of a slam dunk, however, since all 4 of the people who made maps and live in the area said they don’t want to move. Is there a way to bring Ward 7 up to the necessary size by moving areas that had some adherents?
There is a way: move the Arboretum, Fort Lincoln, and the Langdon and Gateway neighborhoods, which is about ¾ of the huge Census Tract 111, into Ward 7. Let’s call this the Gateway scenario.
We only had a few people in each and so the sample size is small, but some people there did pick these changes. Some people in tract 76.01 (Fairlawn) also included moving on their maps, but that’s in Ward 8, so it doesn’t solve anything; moving it to Ward 7 just makes 8 too small again.
If these three areas move, we can also satisfy another request: The people in Kingman Park’s tract 79.03, the one piece of Ward 7 west of the Anacostia, really want to be back in 6. 38 of them made maps, and 89% moved their neighborhood back into Ward 6. With the moves from Ward 5, it would be possible to put Kingman Park into Ward 6, whereas just moving Hill East doesn’t give Ward 7 enough people to also lose Kingman Park.
What about Ward 2? It needs to give up some territory. Under the Hill East option, Ward 2 could give it away to one of several wards. Under the Gateway scenario, it has to give up land to Ward 5, because that ward would need to add people.
The third section of the table shows the possibilities for Ward 2. A lot of people moved the area around gallery Place over to 6, but that doesn’t have enough people to make much of a difference. If Ward 6 loses Hill East, then there are 2 best options: give the Ward 2 portion of Census Tract 4.82, which is northeast of Mount Vernon Square, to Ward 6, or the area southwest of 14th and U (the southern half of Census Tract 43) back to Ward 1.
They both were included in maps at about the same rate, around 30% each. People living in the areas picked moving at about the same rate, 25% each. The other people of Ward 1 were more likely to add the area next to them onto their maps compared to people of Ward 6, but is partly be due to the fact that more people in Ward 6 didn’t move Hill East to Ward 7 at all; just among maps from Ward 6 residents which did switch Hill East, 36% put the Mount Vernon Square neighborhood into Ward 6.
The population numbers do provide a clear answer. If the southwest corner of 14th and U moves, then Ward 1 would become the largest ward, with 77,491, and Ward 6 the smallest, with 72,298. If, instead, Mount Vernon Square moves to Ward 6, they’re much more equal: 76,197 for Ward 1 and 75,745 for Ward 6.
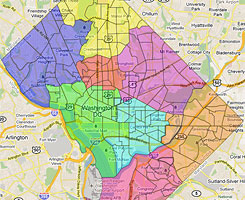
Therefore, here is the best option for the Hill East scenario:
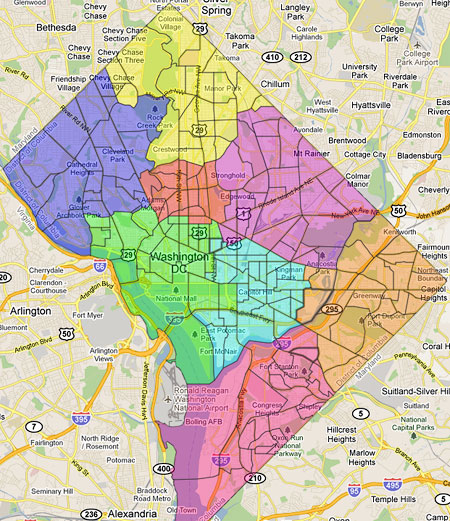
Click for larger and interactive version.
As for the Gateway scenario, there are 2 sections of Ward 2 which were switched to Ward 5 in at least a significant proportion of maps: Mount Vernon Square’s 48.02 again, moved to Ward 5 in 11% of maps, and the Ward 2 portion of Tract 48.01 in Shaw to the north.

The “chimney.”
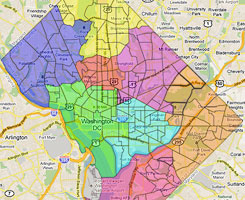
Adding those three pieces to Ward 5 makes it meet the minimum, and therefore here is a working Gateway scenario:
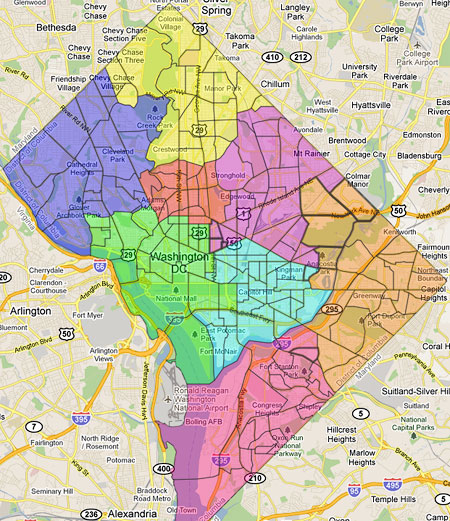
Click for larger and interactive version.
Which is better? There’s no definitive answer. If the goal is to move little land and few people, then Hill East is better. But as it turns out, more residents might be happy with the Gateway scenario.
To estimate that, let’s look again at the areas which move under each. Except for Anacostia Park, which has no people, we know the population of each area and how many residents made maps. Let’s make the rough assumption that those people are representative of the entire area, so that if 1/3 of the mapmakers in an area of 3,000 people chose to move into a particular ward while 2/3 chose not to, we assume that 1,000 people would like to move and 2,000 would not.
Here are the areas that move in the Hill East scenario but not in the Gateway:
| Area | Pop. | From | To | % want move | % Don’t | Happier | Less happy |
|---|---|---|---|---|---|---|---|
| Hill East (68.04) | 3,670 | 6 | 7 | 0% | 100% | 0 | 3,670 |
| Mt. Vernon Sq (48.02) | 2,817 | 2 | 6 | 23% | 69% | 639 | 1,944 |
| Total: | 639 | 5,614 | |||||
639 immediate residents become happier, and 5,614 immediate residents become less happy, for about an 8.8:1 ratio.
In the Gateway scenario:
| Area | Pop. | From | To | % want move | % Don’t | Happier | Less happy |
|---|---|---|---|---|---|---|---|
| Arboretum (111) | 568 | 5 | 7 | 25% | 75% | 142 | 426 |
| Fort Lincoln (90) | 2,732 | 5 | 7 | 25% | 75% | 683 | 2,049 |
| Langdon/Gateway (111) | 2,996 | 5 | 7 | 33% | 67% | 999 | 1,997 |
| Shaw (48.01) | 2,113 | 2 | 5 | 10% | 66% | 211 | 1,395 |
| Mt. Vernon Sq (48.02) | 2,817 | 2 | 5 | 8% | 69% | 225 | 1,944 |
| “Chimney” (46/48.02) | 309 | 6 | 5 | 40% | 30% | 124 | 93 |
| Kingman Park (79.03) | 1,774 | 7 | 6 | 89% | 11% | 1,587 | 195 |
| Total: | 3,971 | 8,098 | |||||
This is an extremely rough guess based on little data, which means you can easily completely disregard it. For one thing, the Hill East area has very few people right now except for people in the DC Jail. Those folks probably don’t share the same feelings about which ward they’d like to be in as the 4 who filled out maps.
However, a lot of development is planned here, and I wouldn’t be at all surprised if the people who are likely to move in to this area would indeed prefer to be in Ward 6 along with their neighbors just to the west. Perhaps, therefore, it all evens out, and thousands of people would indeed be unhappy with the Hill East scenario as compared to the Gateway.
Finally, as we discussed yesterday, politics will certainly play into it. We know Tommy Wells will not like the Hill East scenario and Harry Thomas, Jr. will not like the Gateway scenario.
There are ways to adjust these scenarios. In general, the Redistricting Game limited people to moving whole census tracts, because those are easy chunks to move, and because making ward boundaries conform to census tracts makes it much easier to make demographic computations for individual wards, like determining the rate of homeownership or one of many other things.
But Gateway and Langdon are part of an enormous census tract, 111, which I split into four pieces to provide options. It could be split other ways, giving Ward 7 a little less of Ward 5 and then Ward 5 less of 2 in turn. Ward 5 could keep the Walmart site at Bladensburg Road and New York Avenue, NE. Let’s call this the Simpler Gateway scenario:

This wouldn’t make the Kingman Park people happy, but more of the Langdon, Shaw, and Mount Vernon Square folks who don’t want to move would be happier this way, and it’s certainly more politically palatable, though still not what Thomas would like.
What do you think is best?
The DC Council is having its hearings next week, on Monday, April 25 in the evening and Wednesday, April 27 in the morning. If you’d like to testify, contact Carol Sadler at (202) 724-8198 or csadler@dccouncil.us. You can also email the 3 Councilmembers on the redistricting committee, Michael Brown (at-large), Jack Evans (ward 2) and Phil Mendelson (at-large).