TSI 2.0: Moving toward a fairer allocation of DDOT resources
Close-up of traffic signal on Massachusetts by ep_jhu used with permission.
The District Department of Transportation (DDOT) recently announced a new way of deciding how it will respond when residents request investigations of dangerous roadways.
The Traffic Safety Input program (TSI 2.0) replaces the existing Traffic Safety Investigation program. Instead of launching an investigation in response to every 311 call, DDOT will now prioritize which intersections it considers changing based on a combination of public input, crash patterns, and data on neighborhood characteristics.
So far, this announcement has mostly been met with frustration from those who requested investigations under the old system and are now seeing the TSIs they worked hard to submit unceremoniously closed. But an examination of where DDOT sent resources as a result of TSI 1.0 requests shows that the parts of the District with the most crashes are not reaping the benefits of the TSI program. DDOT’s new TSI approach is necessary to help the agency target the areas with the most dangerous roads rather than areas with the most engaged residents.
The status quo skews DDOT’s resources
In some ways, the outgoing TSI program has been a wild success. Requesting a DDOT investigation has become as simple as making a 311 request, and checking the status of that request is easily done through the TSI portal. Before TSI 1.0 launched in the fall of 2021, residents had to fill out a lengthy Traffic Safety Assessment questionnaire, get a sign-off from their Advisory Neighborhood Commissioner, send it in, cross their fingers, and wait.
TSI 1.0 led to real traffic safety improvements in the District. According to DDOT’s dashboard, the agency installed 962 safety mitigations in response to TSI requests in 2022 alone. This included 36 curb extensions, 408 speed humps or tables, and 518 signs, markings, or other enhancements.
But the number of requests exploded, likely because TSI 1.0 was more accessible than the TSA process. According to 311 data, there were 4,479 requests in 2022, up from 2,639 in 2021.
This increase was not spread evenly across the city. The number of TSI requests submitted grew fastest in Wards 2 and 3, while the number of requests in Ward 8 barely increased at all. This means that TSI 1.0 requests were less likely to be made for wards in which the most crashes happen.
The growth in TSI 1.0 requests from 2021 to 2022 was spread unevenly across wards. Source: Author’s calculations based on 311 service requests from Open Data DC 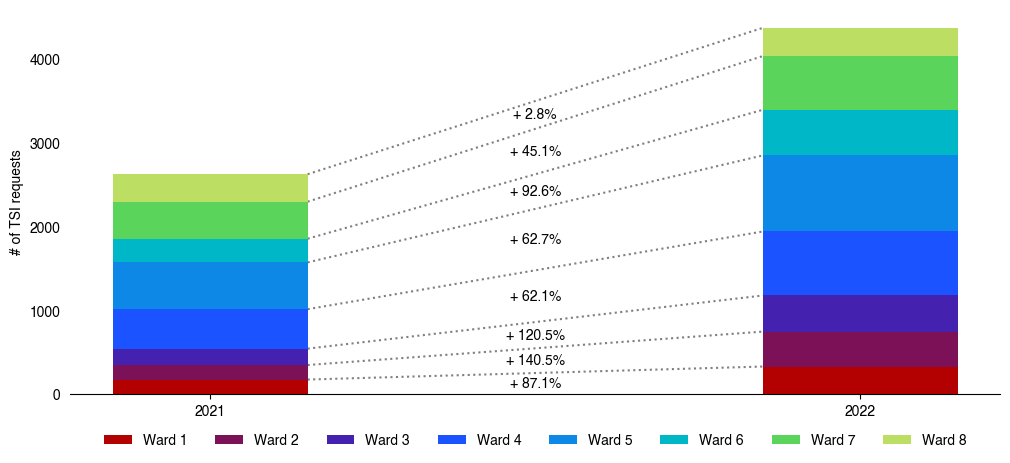
According to a Vision Zero report, 16.6 percent of traffic injuries and 23.5 percent of fatalities from 2017 through 2021 occurred in Ward 8, but last year, just 7.7 percent of TSI 1.0 requests were filed for locations in Ward 8. Ward 3, where 4.7 percent of injuries and 2.1 percent of fatalities occurred, was the subject of 9.9 percent of TSI 1.0 requests.
Even this data likely understates the disparity between where drivers injure or kill people and where residents make the most TSI requests: Crashes in DC are likely underreported by at least 10 percent, and underreporting is worst in wards 7 and 8.
There is ample evidence from DC and elsewhere that the residents who file the most 311 requests are rarely those who most urgently need public services. For example, research shows that whiter and higher-income residents are disproportionately likely to call in for heat and hot water violations,street repairs, and bed bugs relative to their objective need for government remediation.
TSI 1.0 created a valuable channel through which residents could bring issues to DDOT’s attention; no one knows better than the people who use a street regularly just how dangerous that street can be . Those who have taken the time to report dangerous conditions should be applauded for doing so. But given DDOT’s limited resources and the misalignment of where crashes occur vis-a-vis places for which requests are submitted, it would be irresponsible for the agency to commit to investigating every report it receives.
The new TSI 2.0 prioritization model
TSI 2.0 uses a prioritization model to determine which investigation requests will be met. The model considers:
- Crash patterns: Locations with non-motorist crashes and different-direction crashes receive higher priority
- Vision Zero high-injury networks: Locations close to High Injury Network corridors receive higher priority
- Equity: The race, income, and disability status statistics of nearby census tracts are considered in an unspecified manner
- Vulnerable road user trip generators: Locations with more schools, transit stations, senior centers, recreation centers, bike facilities, and pedestrian demand scores receive higher priority
- Roadway characteristics: Locations with fewer traffic controls, more lanes, and challenging road angles receive higher priority
These factors are a major improvement on the first-come, first-served prioritization model that was TSI 1.0, and are more likely to allocate the agency’s resources fairly. While some of these data sources are incomplete, skewed, or value-laden, having a published methodology makes it possible to have a concrete public debate about how DDOT should be allocating its scarce investigation and installation resources.
TSI still needs more ambition
While TSI 2.0 is a better way to allocate DDOT’s limited resources for traffic safety investigations, it is disappointing to see just how limited those resources are. Today, DC is further from Vision Zero than when Mayor Muriel Bowser launched the program in 2015. In a city truly committed to preventing drivers from killing or injuring other people, we wouldn’t debate which dangerous intersections are investigated and which are ignored.
DDOT has only committed to 800 investigations this year, even though last year, it installed well over 800 safety mitigations in response to TSI requests. DDOT has worked hard over the past two years to increase its capacity to respond to TSI requests and lower the barriers to installing safety mitigations. For example, the TSI team can now procure signage through a separate contract rather than waiting for signs to be fabricated in-house. In addition to better calibrating where it installs safety mitigations to where crashes happen, DDOT should continue to find efficiencies, or indicate if it needs more employees, to clear TSI requests.
TSI 2.0 is a step in the right direction, but its scale is underwhelming. Now that it has a better framework for assessing the incoming data that residents provide, DDOT should continue to direct resources to the District’s most dangerous streets in an equally fair and equitable manner.