This animation of the world’s most populous cities over 500 years is amazing
This article was first published on March 26, 2019. It’s interesting to look back at the region’s history, so we are sharing it again.
At more than 700,000 people, DC would have been the largest city in the world 500 years ago. As cities change with the times, the list of most prominent and most populated cities change too, as this “bar chart race” beautifully illustrates.
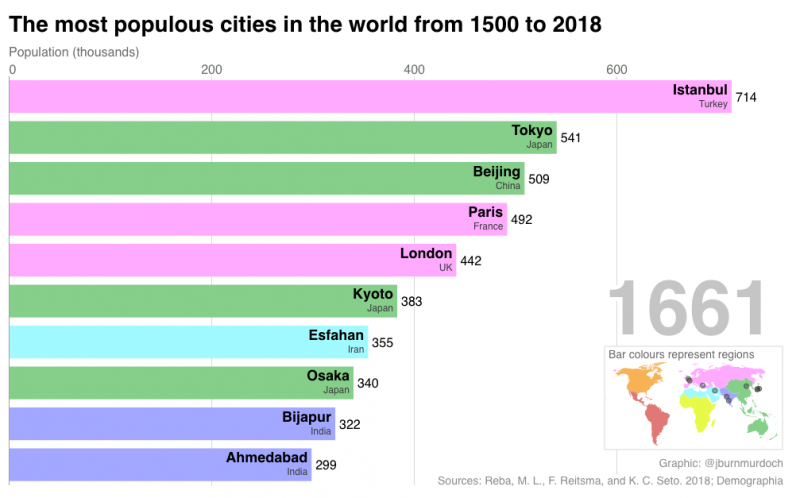
It’s dificult to compare how cities have risen and fallen over time. But John Burns-Murdoch created a mesmerizing visualization of the 10 largest cities in the world year-to-year for the last five centuries for the Financial Times. Rapid change can be seen in times of war or technological innovation. Some cities maintain their stature for centuries. Others rise only to be quickly overcome by larger, more prominent cities.
In 1950, the District cracked the top 10 largest cities in the United States. Today, even as its population grows, recent estimates have it in 20th place, and where it will rank in 2050 or 2100 remains to be seen. Check out Burns-Murdoch’s visualization on Observable and the corresponding video below:
Notice anything interesting? What do you think influences the changes seen over time?