Bus lanes and free transfers are Washington area residents’ top bus priorities

I Street bus lane by BeyondDC licensed under Creative Commons.
Building more dedicated bus lanes and offering free transfers between bus and rail were the top recommendations from residents in a recent public survey for the Bus Transformation Project. Across age, racial backgrounds, and between regular riders and non-regular riders, respondents consistently chose bus lanes or free transfers as their number one priority, and the other one second in almost all cases.
Other top strategies favored by large numbers of residents were running more buses on busy routes, and making bus stops safe, convenient, and accessible. A mobile app for planning and paying for trips, and reducing the cost of bus travel for low-income riders, also placed strongly.
The survey, which was not a scientific poll, collected input from 2,905 people in a combination of an online survey and a series of open houses in DC, Maryland, and Virginia in May. This is part of the larger Bus Transformation Project, an effort to build regional consensus for ways to improve bus service, governance, and finance in the region. Disclosure: I am a member of the Executive Steering Committee for the project, which got a look at these findings a few weeks earlier, but this data is all now public.
What residents said were top choices
All graphs from the Bus Transformation Project. 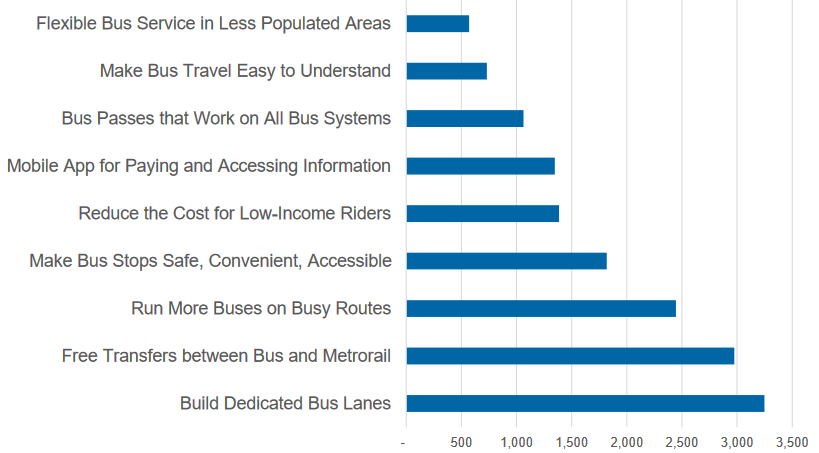
Each person responding was asked to choose three out of nine recommendations as the ones they saw as the highest priority. Dedicated bus lanes, which give buses a lane to avoid being stuck in traffic, was on 1,512 people’s lists. People then ranked their three choices, and the study team used that ranking to give each one a weighted score; this recommendation was again number one.
This matches findings from a Washington Post poll which found 56% of the region’s residents supportive of dedicated bus lanes, and 66% among DC residents.
The second finisher was free transfers. Among transit agencies that operate both bus and rail, the majority let people transfer between the two for free. WMATA has the most punitive structure for bus-rail riders, with people having to pay two full fares less a 50¢ discount. 1,487 survey respondents said this was a high priority.
Below bus lanes and free transfers were a pair of other highly-performing recommendations: “run more buses on busy routes” and “make bus stops safe, convenient, and accessible.”
The least-often chosen recommendations were to “run flexible service in less populated areas,” which is the idea of using services like “microtransit,” such as the pilots Via is running in both DC and Montgomery County. It’s unclear how much the low score reflects people not being very familiar with these types of services and whether they can provide better service to riders or worse. Theoretically, it could be better if the wait times and travel times are superior to taking an every-half-hour bus that follows a winding route, but riders need to see actual improvement to believe anything.
Making bus travel easier to understand came in second from the bottom. While the bus numbering system can be inscrutable, for the most part people either are familiar with the bus they ride or can use an app to figure it out. Certainly some people don’t ride the bus because they find it confusing, but it’s not clear here or from other cities how much better information changes that, versus running faster, more frequent, and more reliable service.
Middle-performing recommendations including making bus service more affordable for low-income riders; a unified mobile app to get information and pay fares; and bus passes that work not just on Metro but all of the regional bus systems as well.
How different groups of riders prioritize these
The survey also broke out regular riders versus infrqeuent ones, black and white residents, and low-income riders from the rest. For the most part, the recommendations are similar.
For regular bus riders, free transfers beat out bus lanes as the top request, but bus lanes was still second, while infrequent riders favored bus lanes. The same applied for non-white respondents, whose number one choice was free transfers but whose second choice was still bus lanes.
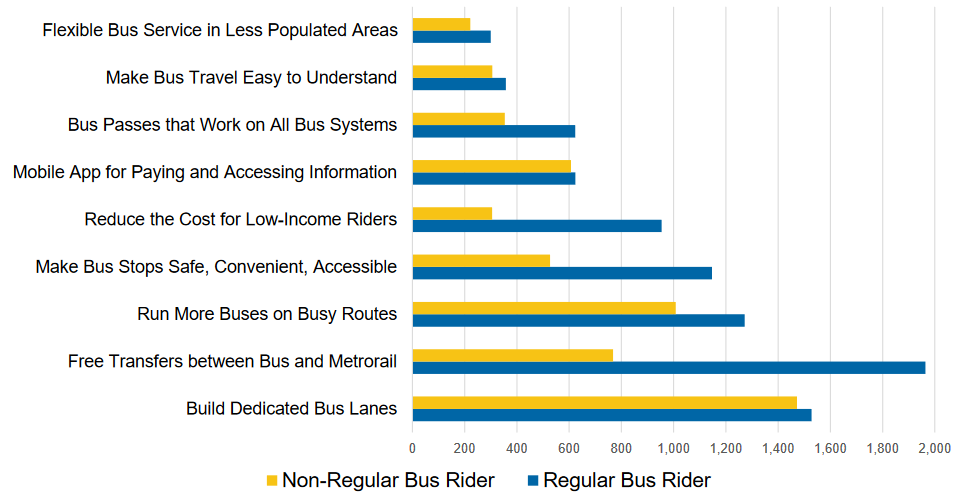
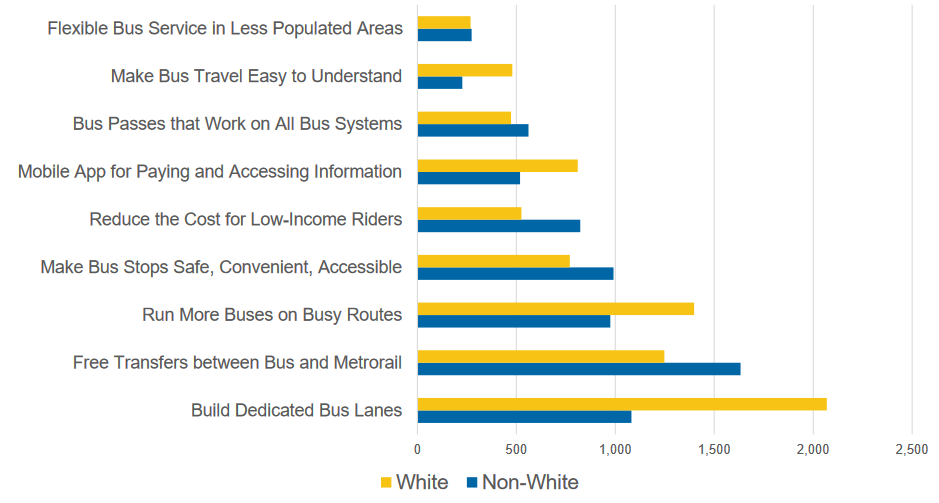
Infrequent riders, and white riders, put a mobile app with information and payment fourth rather than the sixth it placed overall. Other than placing free transfers first and bus lanes second, non-white riders (who made up 48% of respondents) generally had similar preferences to the total group.
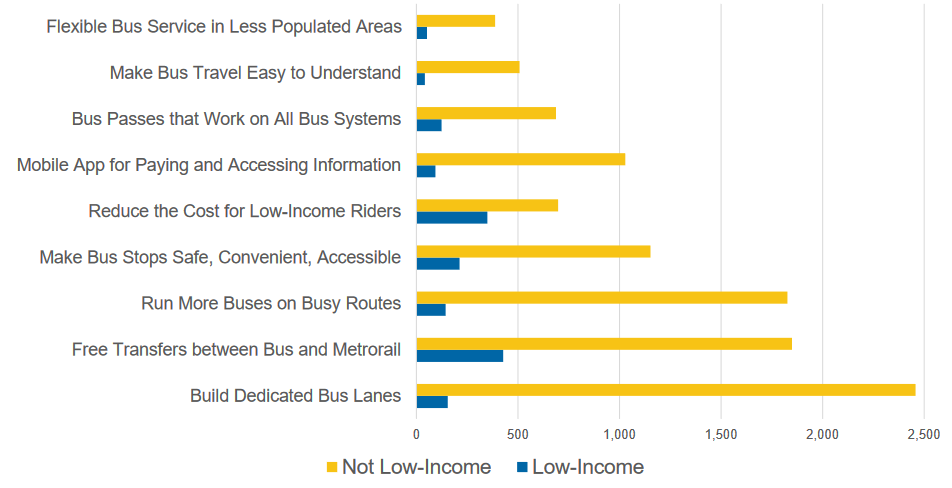
Low-income riders had a somewhat different ranking. They also put free transfers number one, followed (perhaps not surprisingly) by reducing the cost for low-income riders. Bus lanes placed fourth.
Third was “make bus stops safe, convenient, and accessible.” The difference between bus stop quality in various parts of the region can be stark, with crime around bus stops in higher-crime areas. In some suburban locations, especially lower-income ones, there are often bus stops that amount to litlte more than flags on the shoulder of a high-speed artery lacking sidewalks which force people to cross dangerously just to get to the bus.
The "winner" of Streetsblog's 2016 "Sorriest Bus Stop in America" contest, in Silver Spring, originally submitted by GGWash Editorial Board member Dan Reed. Image by Google Maps.
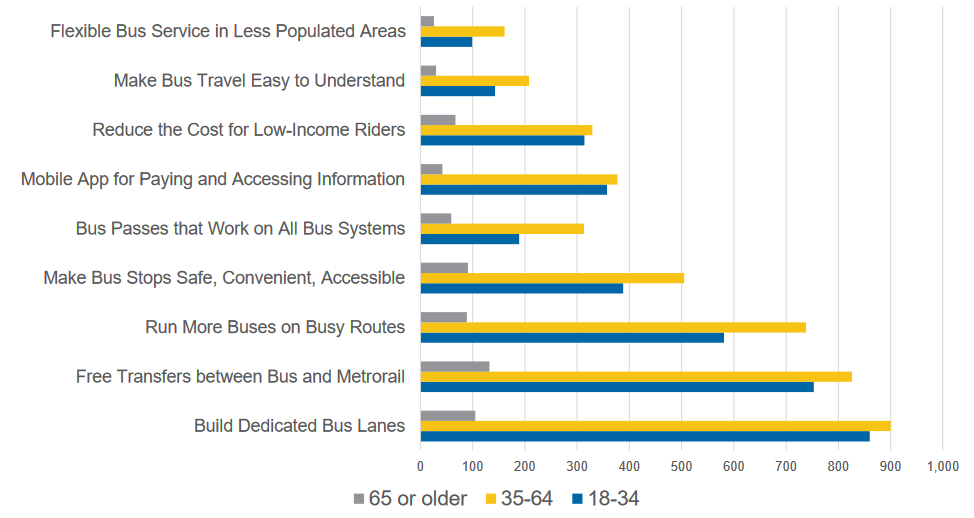
Older riders, like so many other groups, also put free transfers first and bus lanes second. Also not surprisingly, older riders (65 and over) ranked a mobile app particularly low, while younger riders aged 18-34 placed it much higher than the overall sample.
Finally, bus lanes and free transfers were the number one and two choices in every jurisdiction. However, in Montgomery, Prince George’s, and Fairfax counties free transfers came out higher, perhaps because those counties have many people who do transfer. In DC, Arlington, Alexandria, and Loudoun, bus lanes came out first.
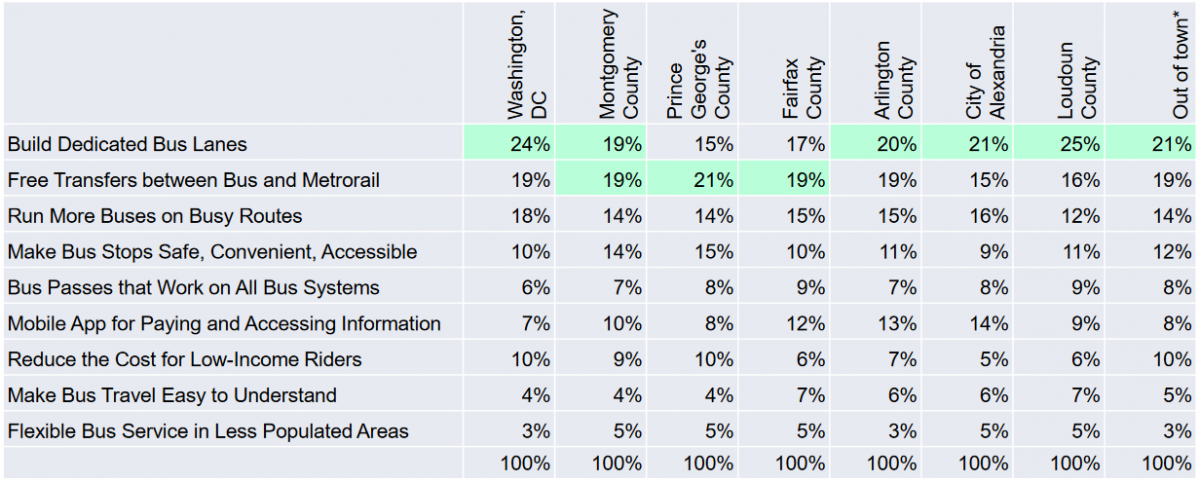
Still, while these differences are interesting, it’s important to keep in mind that these two strategies, bus lanes and free transfers, were first and second for every jurisdiction, both non-white and white residents, all age categories, and every other subgroup except for low-income riders, who still put bus lanes fourth.
These strategies are certainly not mutually exclusive either. If the region works to achieve the top two (while also working toward the other seven), it can meet all groups of riders’ top priority.
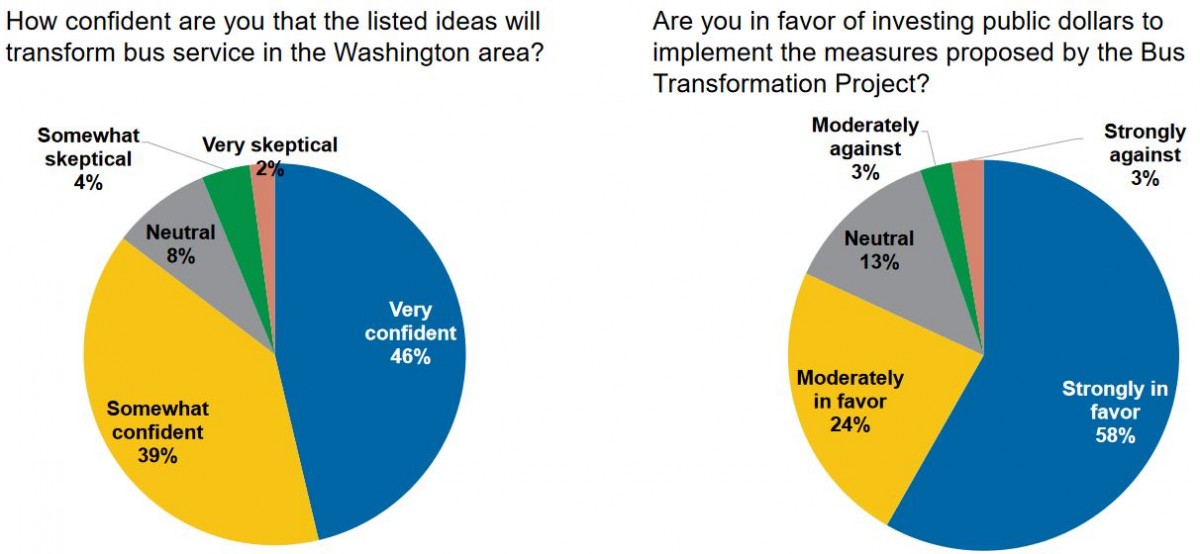
People think these changes will make a difference
The survey also asked people if they think these changes would “transform bus service,” and if they’re worth spending public dollars on. For transformational, 85% said these would be, and 82% favored spending public dollars on them.
What do you notice in the results?