Here’s a primer to help you read a city budget

Petworth library by dullshick used with permission.
A version of this article was first published by the DC Fiscal Policy Institute. Head here for the first installment.
Let’s say you’re a devoted user of your neighborhood library. You want to make sure your branch continues to be open on evenings and weekends, that children’s story hour happens, and that New York Times bestsellers get stocked at your branch.
You want to advocate for the library system at city hall—known in DC as the John A. Wilson Building. What do you do?
First, there are certain questions for which you need answers. What is the library system’s budget? Did it get cut last year or did it get enhanced? How does the system spend the money it receives?
These questions can be answered by looking at the library budget, which can be found in the budget section of the Office of the Chief Financial Officer’s website. If you are looking between March and June, you’ll find information on the Mayor’s proposed budget for the upcoming year (in addition to information on the current-year budget and last year’s). Once the budget is approved in June, the documents will reflect the final budget as approved by the DC Council for the year.

The DC budget documents provide a set of information on every DC agency. These are the city departments identified by the service provided: Department of Transportation, Fire and Emergency Medical Services, Department of Housing and Community Development, etc.
Let’s take a closer look at the agency budget chapter for the DC Public Library, using the proposed FY 2018 budget as an example. It is found under the Public Education System appropriation title.

When you find the library chapter, you will see this table, CE0-1. What does it tell you?
- The previous year’s actual spending by the agency, and the number of workers at the agency (full-time equivalents, or FTEs) (FY 2016 Actual).
- The current year budget and FTEs (FY 2017 Approved).
- The proposed budget for the upcoming year and FTEs (FY 2018 Proposed).
- The percentage change in dollars and FTEs between the current year and next year.
FY 2016 reflects the actual dollars spent on the library system, based on the city’s annual audit of its books. FY 2017, which was the current fiscal year in this budget document example, denotes spending that has been approved, but not actual spending because that fiscal year is not over. FY 2018 is the upcoming year in this example, so that reflects the dollars proposed to be spent.
You will see that the city spent $56.5 million on libraries in FY 2016. Approved funding was increased by $3.8 million for FY 2017, to $60.3 million. For FY 2018, library funding was increased 2.5%, to $61.8 million.
As a library advocate, you might be curious as to why the additional money was allocated. Before we figure out why money was added, it’s helpful to know where the additional money comes from in the first place. There are several key tables that show up in the budget chapter for every agency that help explain the agency’s funding trends. The title of each table also includes a three-letter code for the agency. The code for the DC Public Library is “CE0.”
Table CE0-2 shows the sources of library funding. The table lists all the possible streams of revenue: local, special purpose, federal, private, and Intra-District funds.
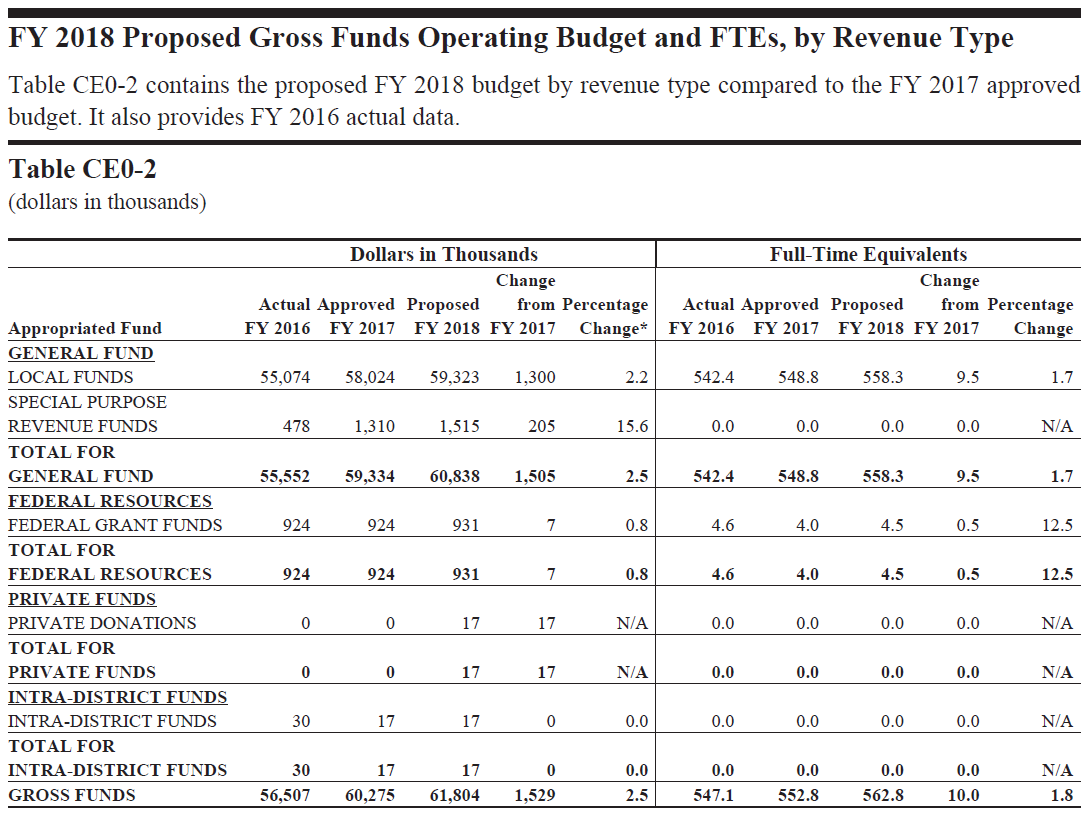
First, a few terms: The General Fund is revenue generated by the District. This includes local funds, which reflect the basic collection of taxes and fees, as well as special purpose revenues, which are usually fees or fines collected by the agency that are then reinvested in the agency. For example, parking meter fees help fund Metro.
Gross funds combine all the sources of funding, including federal funds, any private dollars, and resources from other DC agencies; it is the total amount spent.
Intra-District funds are services provided by one District agency on behalf of another agency. For example, the library receives help from the Office of the Chief Technology Officer on broadband access. Intra-District funds also reflect federal funds received by one agency but transferred to another. For example, DC gets federal funds for its TANF program through the Department of Human Services, but a portion is transferred to the Office of the State Superintendent of Education to support the child care programs administered by the state superintendent.
For the DC public library system, a majority of funding comes from local tax dollars, which you can see by looking at the Total General Fund line. Total general fund support was $55.5 million in FY 2016, and federal funding was $924,000. The mixture of funds varies from agency to agency. Federal dollars are more available for certain programs in human services, for example, than for public works.
A general guideline for examining budgets is to see how they have changed from year to year. Look for big spikes and big declines. Did costs jump or fall in one area? Why? As you’ll notice, the budget can answer some questions, but it will raise others.
When you compare budgets from year to year, make sure that you compare apples to apples. Sometimes, for example, the general fund amount may change from year to year, but gross funds might remain the same because of an increase or decrease in federal dollars.
Table CE0-2 also shows how many full-time equivalent positions, or FTEs, in the Library System are funded by various revenue sources. Table CE0-2 shows, for example, that 542 positions were funded with general fund dollars in FY 2016. FTEs include librarians and other staff.
The next chart, Table CE0-3, details spending by personal services and non-personal services. Personal services include pay and other costs associated with employees. Nonpersonal services include the costs of office supplies, rent (if the agency rents space), contracts for services, etc.
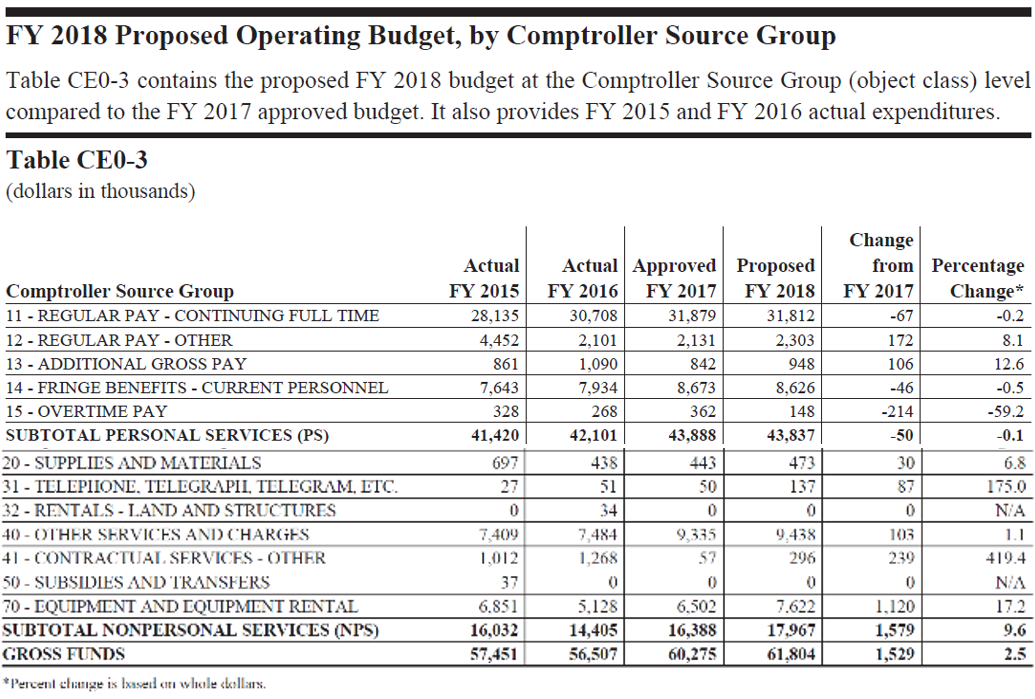
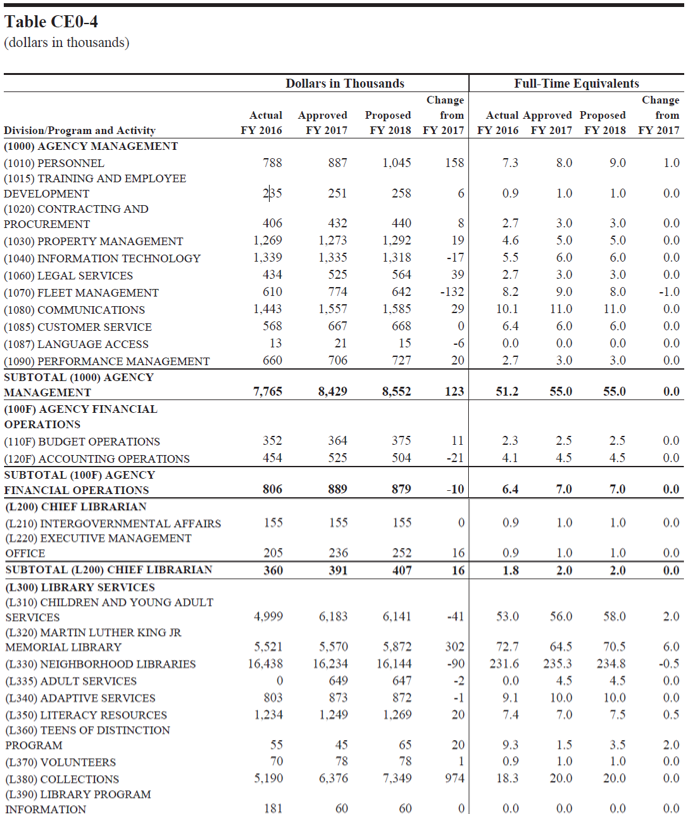
Table CE0-4 breaks down the agency at what is known as the program and activity level. These are the detailed line items that show how the library’s budget is spent. For example, one of the programs in the agency is called Library Services (L300). One activity within the Library Services program is Martin Luther King Jr. Memorial Library (L320), which is operations for library system’s main branch. You’ll see that funding for MLK library has fluctuated slightly but maintained relatively stable over the last three years (roughly $5.5 million each year).
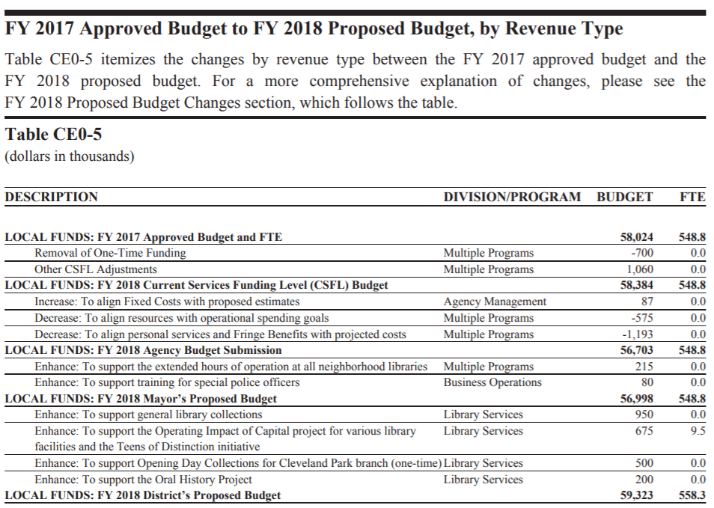
Will be there be any new neighborhood libraries opening? What will the library system do differently from last year? These questions are answered in Table CE0-5 and the accompanying narrative. This section highlights the major changes proposed in the budget. That is explained in the narrative under Agency Budget Submission, Mayor’s Proposed Budget, and District’s Proposed Budget. Sometimes the explanations are very clear, and sometimes they’re not, in which case a call or email to the relevant DC Council committee that has oversight over the agency may be in order.
The last part of the agency budget chapter has various performance measurements. These are created by the agencies to measure how well they are delivering services. They also contain general facts about the agency, such as how many books were circulated in the library system that year. The performance information for some agencies is better than for others—that is, more complete and reflective of the agency’s key functions. Pushing for better measures is an important role that residents can play.