The economics of school performance in the Washington region

Image by Chirstian Bucad licensed under Creative Commons.
In the US, it’s typically the case that high schools with higher percentages of economically disadvantaged students have lower rankings, and fewer kids who attend them come out ready for college. Our region's schools in Virginia and Maryland largely follow this trend, but in DC, where the majority of public school students qualify as economically disadvantaged, the numbers look a little different.
Where the data comes from
Each year, US News and World Report ranks over 19,000 US public high schools. These rankings take into consideration things like college readiness index, advanced placement (AP) testing, graduation rates, and math and English proficiency. The rankings also report on the percentage of economically disadvantaged students (EDS) in every school, which is defined by the percent of students eligible to receive free or reduced price lunches.
In addition to the US News and World Report rankings, there are Great Schools ratings, which are mostly based on how students perform on standardized testing when compared to other schools within the state. Each school receives a grade on a 1 to 10 scale, with scores being relative to other schools in the state and higher scores being better than lower ones.
Great Schools ratings are very important because popular real-estate websites like Redfin, Zilliow, and Trulia all publish them with home listings.
I compiled the information from US News and World Report and Great Schools for public high schools in our region. I also looked at the college readiness index numbers that go into the US News rankings, which measure student performance on AP and IB exams. College readiness is ranked on a 100-point scale, and the national average is 20.17.

Looking at these numbers allows us to better understand the role economics play in school rankings for DC and the immediate surround areas.
Virginia has the highest scores
Among the three jurisdictions, the Virginia schools in our region (I’m defining them as Fairfax and Arlington Counties, along with Falls Church and Alexandria) have most of the highest Great Schools Ratings and highest overall percentage of college-ready students. They also have the smallest percentages of economically disadvantaged students.
Data from the US News and World Report. Image by the author.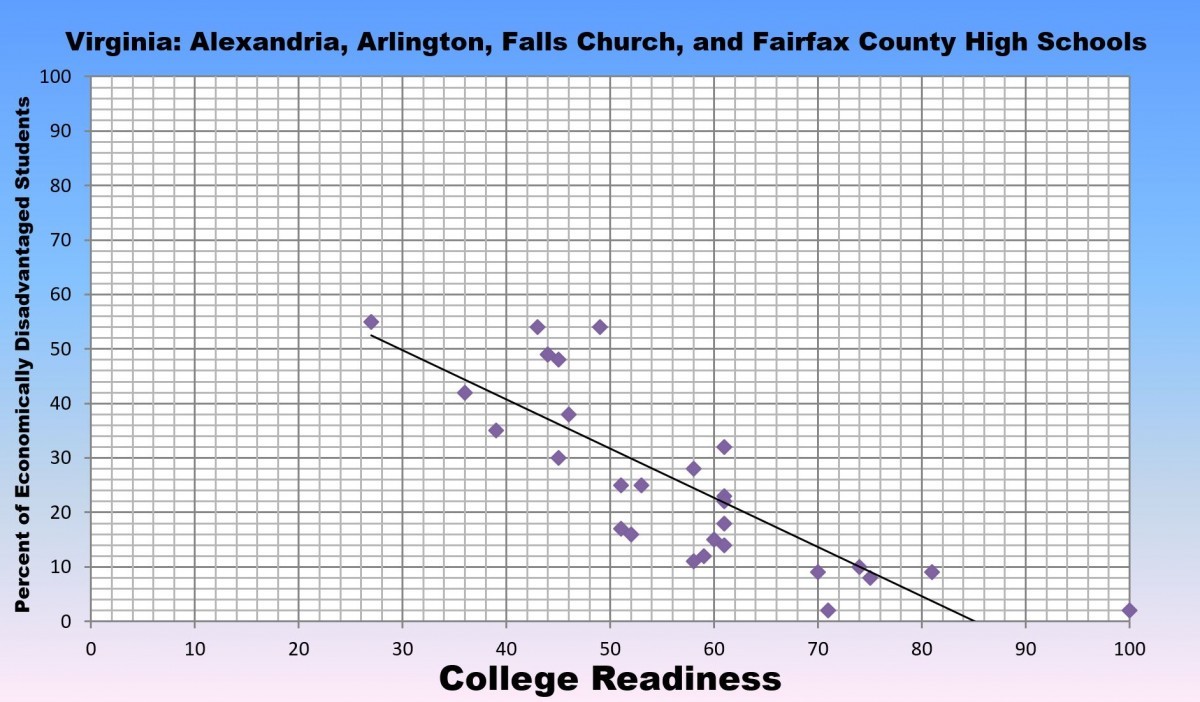
In fact, the US News’ top seven public schools in the state— Thomas Jefferson, McLean, Madison, George Mason, Oakton, Langley, and Woodson— all come from these same Northern Virginia School Systems. These top seven schools are also the only schools in these four school systems where less than 10% of the students are economically disadvantaged.
Conversely, the eight schools in the region with the highest population of economically disadvantaged students are also the only ones with a Great Schools rating of four or less.
Data from Great Schools. Image by the author.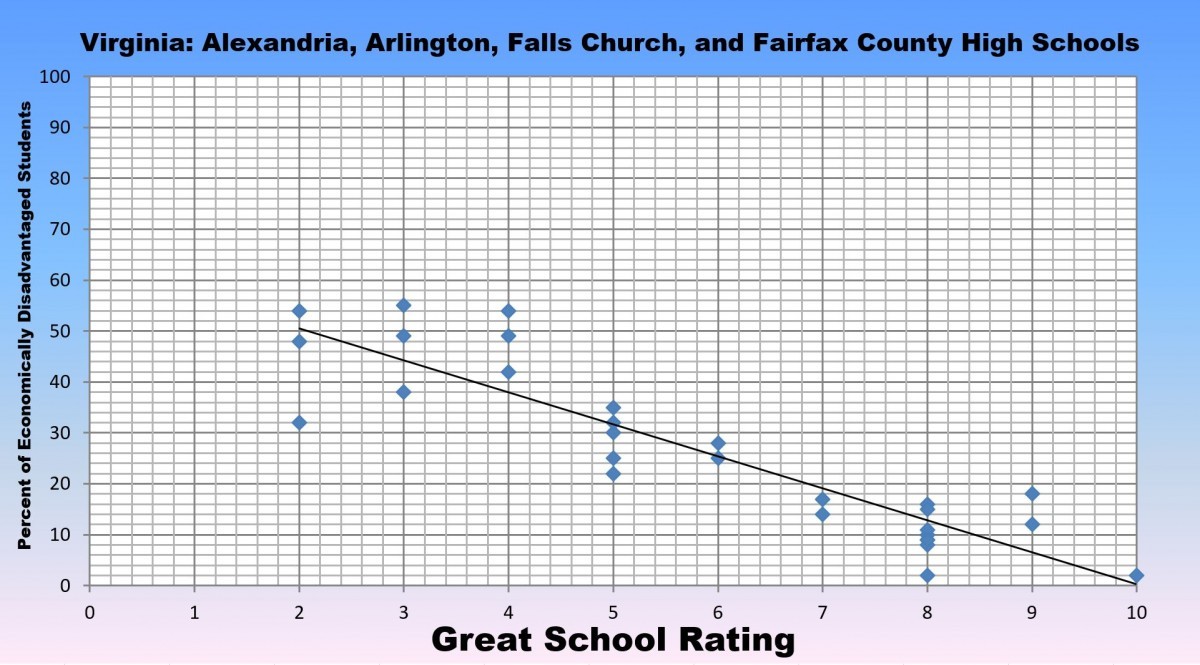
All combined, 26% of the students in our region’s Virginia high schools are economically disadvantaged. But when you look at individual schools, the EDS population ranges from two to 55%. Overall, college readiness and Great Schools ratings follow this trend as well, with lower scores at schools with more economically disadvantaged students.
Maryland looks a lot like Virginia
Maryland’s two counties in our region are very different. Similar to Virginia, the top five schools in Maryland were ones where economically disadvantaged students made up less than 10% of the population; all five of those schools were in Montgomery County.
Data from the US News and World Report. Image by the author.
Richard Montgomery High, which ranks sixth in the state and is also in Montgomery County, is made up of 19% EDS. Montgomery County’s overall college readiness mirrors the Virginia schools at 56%.
Meanwhile, in less affluent Prince George’s County, there are no schools in the Top 25 in the state. Prince George’s college readiness is closer to DC’s rate at just under 20%.
For Montgomery County, the lowest Great Schools rating among all of it’s schools is 4 (several schools have this number). Similar to Virginia, Montgomery County schools follow the trend of lower scores being tied to an increased amount of economically disadvantaged students.
This is all in stark contrast to Prince George’s County, where the county average for Great Schools rating is 3.1. There are outliers, though: on one hand, Oxon HIll is made up of 42% EDS but has a Great Schools rating of 6 with a college readiness of 30%. On the other, Friendly High School, also 42% EDS, has scores of 2 and 12% in the same categories. And Gwynn Park has only 30% EDS, well below the County average of 50% EDS, but has the second lowest percentage of students prepared for college.
Eleanor Roosevelt has the fourth lowest EDS in the county and a Great Schools rating of 8, but the schools ahead of it and behind it in EDS have Great Schools ratings of 3 and 4 respectively.
Data from Great Schools. Image by the author.
The District differs in some ways
Washington DC’s data is much different than Maryland and Virginia because nearly all of the public school students there receive free or reduced lunch, which means they’re categorized as economically disadvantaged. Despite this high rate of EDS among schools, the results you might expect based on numbers from Virginia and Maryland don’t bear out in DC.
The percent of college readiness in DC schools ranges from as low as 6.4% and as high as 85%, with an average of 27%. The highest marks go to the District’s magnet schools, while the lowest go to regular high schools. Despite having the fewest schools of the three areas, the District has six of the region’s eight lowest-ranking schools in terms of college readiness.
Despite schools having similar EDS makeups, DC’s graduation rates vary from just below 40% to several above 90%.
Great Schools ratings are based on comparison to other schools within the state rather than on a national level. As a result, every state will have schools that score low and those that score high regardless of how they compare to neighboring states. When comparing the limited numbers of high schools in the District, the scores will vary.
Differences between schools are clear. Solutions aren't.
This data shows that for the most part, economic make up drives school performance in our region. These go for rankings like US News and World Report, scoring systems like Great Schools, and the student body’s college readiness.
The outliers may provide a window on strategies to help economically disadvantaged students to succeed.
For instance, Prince George’s Eleanor Roosevelt has a Great Schools rating of 8, which is quite strong, despite having an EDS population of 37%. In Montgomery County, on the other hand, the four schools that had Great Schools Ratings of 8 had an average EDS population of 11%, and none’s population was higher than 19%.
It’s possible that schools with high EDS populations could look at Eleanor Roosevelt for lessons on how to buck the trend of lots of EDS students meaning low Great Schools ratings.
Ultimately, our challenge will be to incorporate creative ways to help bridge these economic gaps for the future of our children.