Changes in Metro ridership, in five charts
Between 2011 and 2015, the average number of riders that entered a Metro station dropped from 8,500 per station to 7,400. During the same time, the only Metro station to see a big jump in ridership was NoMa-Gallaudet. I graphed these numbers, and more, after Metro recently released five years’ worth of data.
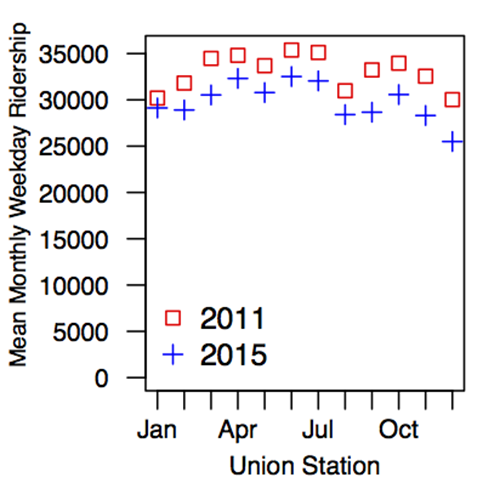
Ridership at Union Station in 2011 vs 2015. All graphics by the author.
Comparing ridership from 2011 to 2015, I see five main ways to categorize changes at individual stations:
- No change, or only a subtle change in ridership
- Pronounced decline in ridership
- Pronounced increase in ridership
- Silver Line-related ridership changes
- Seasonal or weather-related ridership changes
In order to help illustrate these patterns, I graphed the data and pulled out some of the most interesting stations. For all plots below, monthly ridership in 2011 is shown as red squares, and ridership for 2015 as blue crosses.
1. No change, or only a subtle change in ridership
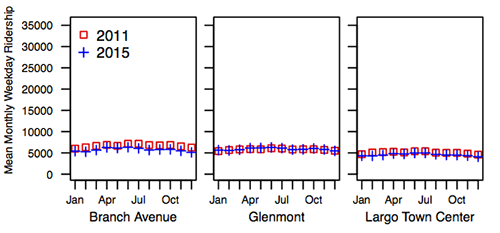
Average weekday ridership at Branch Avenue, Glenmont, and Largo Town Center stations in 2011 vs 2015.
Many of the stations in the system appeared to show either no decrease in ridership, or only a slight one. Around 55-60 stations fit into this category, or around 60 percent of the Metrorail system.
2. Pronounced decline in ridership

Average weekday ridership at Metro Center, L’Enfant Plaza, and Gallery Place-Chinatown stations in 2011 vs 2015.
The combined effect of all the subtle declines near the edges gets sharper when you look at bigger drop offs at the system’s core stations, including Metro Center, L’Enfant Plaza, and Gallery Place. In total, around 20 of the 91 total Metro stations fit into this category.
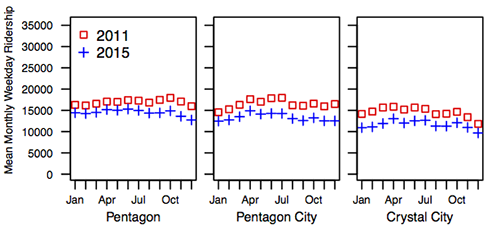
Average weekday ridership at Pentagon, Pentagon City, and Crystal City stations in 2011 vs 2015.
All stations in south Arlington saw declines in ridership. What is it about that area that has changed in the last four years? Perhaps this is an area that WMATA should focus efforts to boost ridership? Or perhaps success of the Metroway bus service between Alexandria and Arlington has shifted passengers away from the rail system?
3. Pronounced increase in ridership
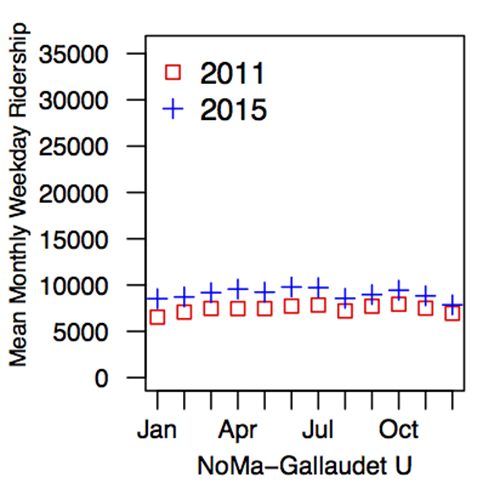
Average weekday ridership at NoMa - Gallaudet University station in 2011 vs 2015.
The only station to see substantial increases in ridership over this time period was NoMa. The station saw ridership increase from an average of 7,400 riders per weekday to over 9,000/weekday over the period of this data, an increase of over 20 percent. This is not surprising given the amount of development that has occurred in this area around the station.
In this context, a “substantial increase” in ridership is based on an increase of 1,000 average weekday riders over the course of the entire year of data. This helps show that the ridership change isn’t temporary or a short seasonal change, but one that will affect the station long-term.
4. Silver Line related ridership changes
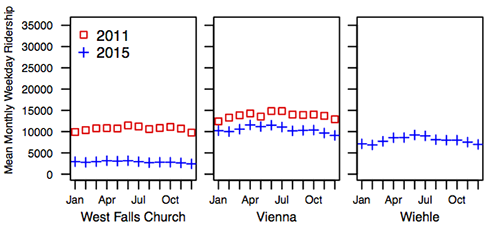
Average weekday ridership at West Falls Church, Vienna, and Wiehle-Reston East stations in 2011 vs 2015.
The opening of the Silver Line, as you might guess, greatly impacted the end of the Orange Line stations. You can see Wiehle picking up some of those declines.
Average weekday ridership at West Falls Church declined by almost 75 percent when the Silver Line opened. This shift is due in part to people using the five new stations that opened, as well as the bus route changes that shifted many away from departing/arriving West Falls Church. The five new Silver Line stations carried an average weekday ridership of just under 3,000 people across all of 2015.
5. Seasonal or temporal related ridership changes
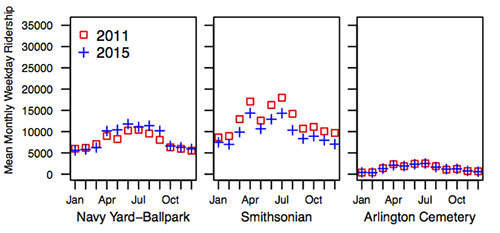
Average weekday ridership at Navy Yard-Ballpark, Smithsonian, and Arlington Cemetery stations in 2011 vs 2015.
You can always tell when it’s baseball season by looking at ridership at Navy Yard-Ballpark station. 2015 was a better season for the Nats than 2011, which might be why the former had higher ridership.
Smithsonian station always shows when it’s cherry blossom time (noted by the sharp increase in average ridership in April), tourist season (increased ridership during the summer months), and the 4th of July (sharp increase in average ridership for the month of July). Arlington Cemetery similarly shows average ridership increases over the summer when the weather is nice, and decreases to under 400 average riders per weekday during the cold season (also when the station closes earlier), although to a lesser extent.
The stations selected are only representatives from across the whole system. You can find plots showing the entire system and other more granular data here. What else have you found in the data that’s interesting?