Here’s how incomes have changed in DC since 2000
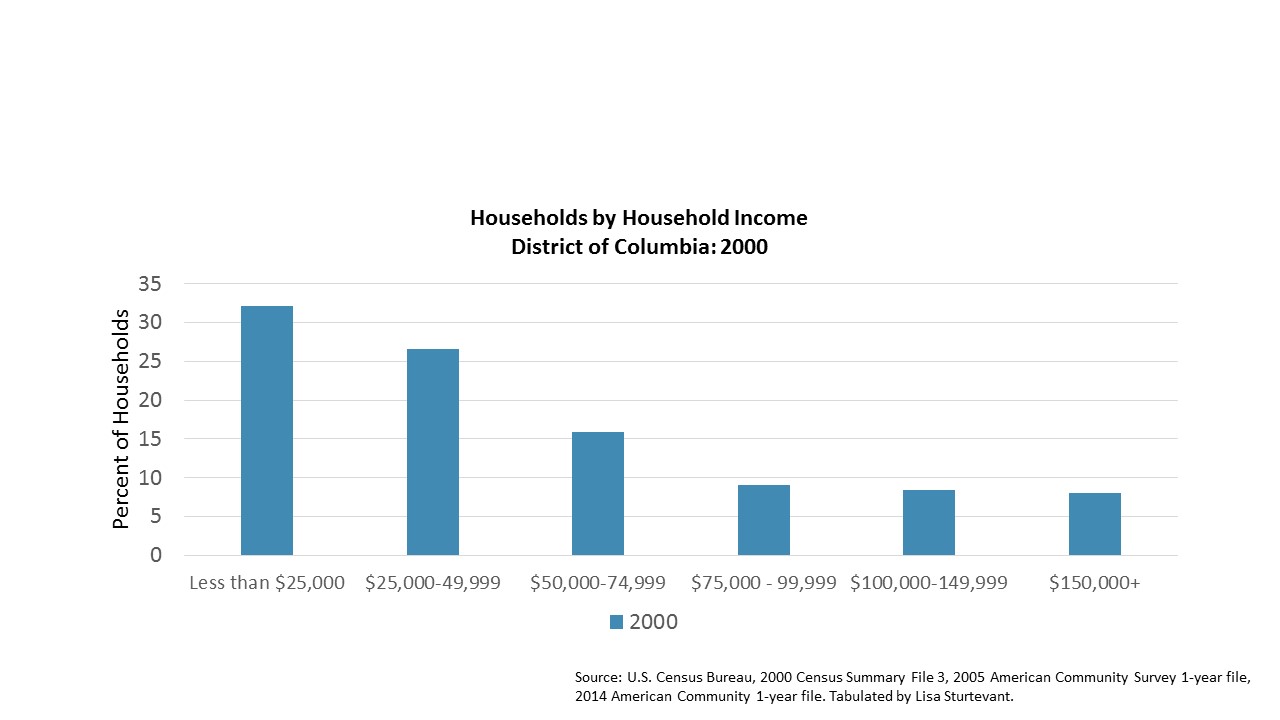
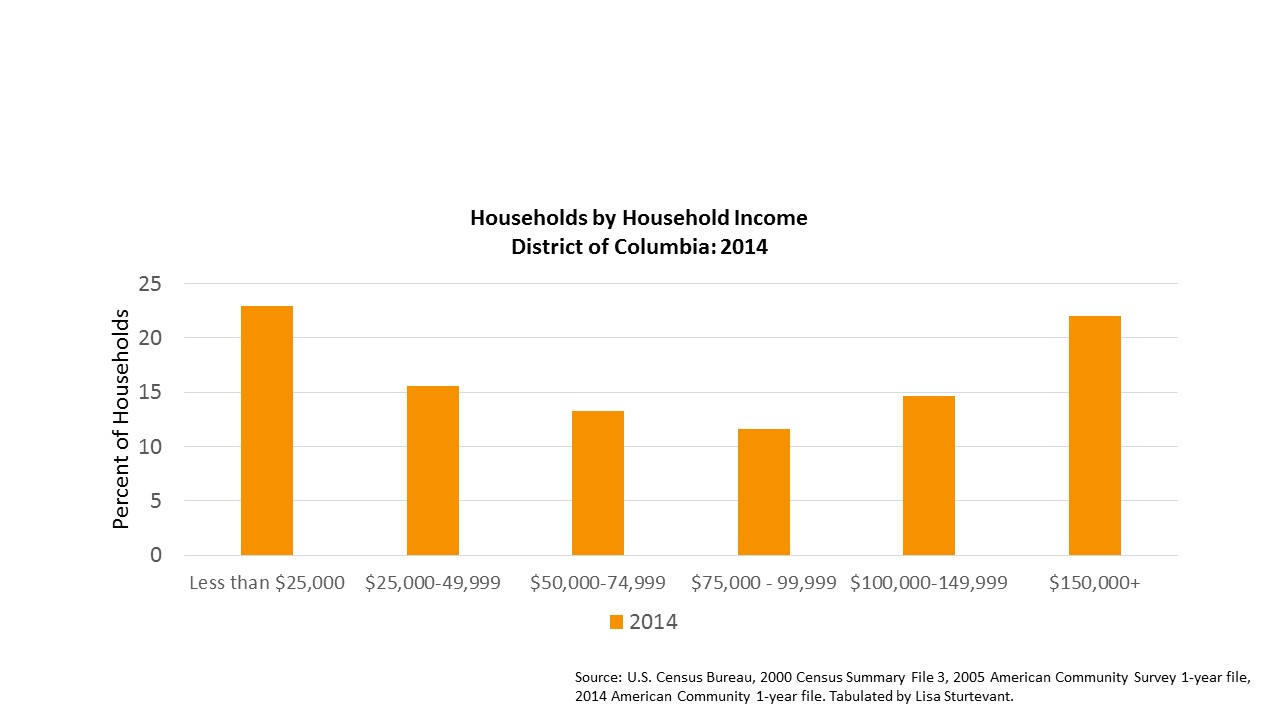
Over 20% of DC’s households make less than $25,000 per year. About the same number make over $150,000. That first group has has shrunk since 2000, when it accounted for over 30% of the population, while the number of high-income residents has more than doubled.

Graphs by the author.
As the District has attracted thousands of new residents in recent years, a lot has been said about how new arrivals are different from many of the people who have been here for a long time. According to data from the Census Bureau, one place where that’s quite evident is in the city’s distribution of household incomes.
DC has become a textbook example of a place with a missing middle class.
The number of households making between $25,000 and $74,999 has gone down, and there are far less of them than both high-income ($150,000+) and low-income (less than $25,000) households. There has also been a big uptick in households making $100,000 or more.
Compare the income distributions in 2000 and 2014. These graphs reflect the reality that the District is a much different city now than it was in 2000. The U-shape if the household income graph for 2014 is striking.
What happens to a city when its middle class disappears? What are the challenges to the city developing priorities when there is this growing income divide among residents? Is a city with a shrinking middle class sustainable? And if the widening income gap among city residents is a problem, what is the solution?