Test scores are not improving for at-risk student groups
DC Public Schools Chancellor Kaya Henderson announced the system’s 2014 test scores yesterday, saying “we’re continuing on an upward trajectory.” However, a closer look at the scores reveals a stagnant or downward trajectory for black, Hispanic, low-income, English language learner, and special education students in the last five years.
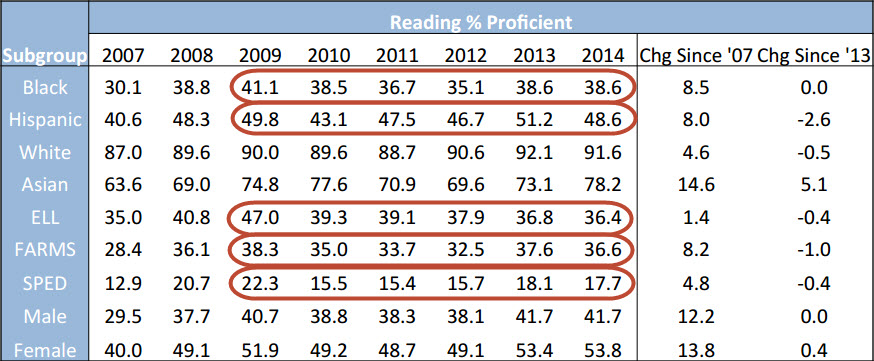
Reading scores have declined among at-risk groups since 2009. Graph from DCPS with emphasis by the author.
It’s true that reading test scores overall have increased since 2009, and slightly overall since last year. However, it’s a different story for many demographic subgroups, including every at-risk subgroup: students receiving free or reduced price lunch (FARMS), black students, Latino students, special education students, and students whose first language is not English (called “English Language Learners”). For those students, scores have declined since 2009 and further since last year.
Math scores are mixed among at-risk subgroups since 2009
While reading scores have declined since 2009 among all at-risk subgroups, math scores look better.

Black and Hispanic students have gained on average since 2009, though white students have gained even more. Lower-income (FARMS) students and special education students gained slightly, while English language learners lost considerable ground.
The achievement gap is widening
The decline among at-risk subgroups, along with gains among white and Asian students, has widened the achievement gap in DC. The every-other-year federal test, NAEP, reports the gap between students eligible and not eligible for free and reduced price lunch.
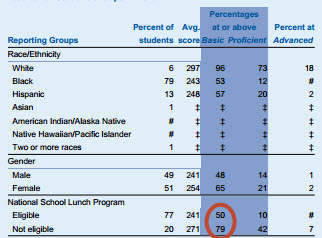
2013 Department of Education report of 8th grade NAEP test scores with emphasis by the author.
However, this gap is nowhere in the 2014 CAS score reports by the Office for the State Superintendent of Education (OSSE) or by DCPS. The Department said the following about this achievement gap in its most recent report on DC NAEP scores.
In 2013, students who were eligible for free/reduced-price school lunch, an indicator of low family income, had an average score that was 31 points lower than students who were not eligible for free/reduced-price school lunch. This performance gap was not significantly different from that in 1998 (25 points).
What does this mean for reform policies?
Can we draw any conclusions about DCPS’s reform efforts from this data?
Scores did increase substantially in reading as well as math from 2007 to 2009, and are still above 2007 levels in all categories. DC Public Schools (DCPS) officials argue that 2007 should be the baseline (and therefore we should consider their reforms a success) because mayoral control of DCPS began in 2007.
However, the IMPACT teacher evaluation system went into effect in 2009. The first round of DCPS school closures was announced in the spring of 2008, and implemented over the next two years, well after students had taken the 2008 CAS test.
Most students taking the CAS tests in the spring of 2007, 2008 or 2009 were still unaffected by the IMPACT system or by school closures.
On the other hand, it may still be too early to judge the effects of any particular reform. Still, we must ask, how long will it take to know for sure?
Is DCPS really “on an upward trajectory”? If DC’s education system is slowly growing but not for those groups where public education is most likely to make or break success in life, it is not doing its job.