Mapping the Washington region’s activity centers

Rosslyn, one of the primary activity centers, as seen from the National Mall by Joe Flood licensed under Creative Commons.
Greater Washington is one of the United States densest metro areas, but this density is not equally distributed across the region. In a recent report from Brookings Metro, (where I am a senior research assistant) my co-authors and I identified places where assets—jobs, retail, civic institutions, and so on—concentrate in our region and other large metropolitan areas across the country.
Where are DC’s activity centers?
While the density of cities and metro areas is commonly measured in terms of population alone, cities work by creating proximity between people and opportunities, stimulating innovation and increasing productivity. To account for the diversity of places where people and opportunities connect, we identified clusters of assets, which we call “activity centers,” in each metro area based on the concentration and mixture of five types of assets—community institutions, tourism destinations, consumption amenities, large institutions, and economic production—within individual US census block groups.
We then classified activity centers by strength—the concentration of assets within them relative to the metro area as a whole—and diversity—how many types of assets are concentrated within them. We labeled the strongest activity centers “primary centers,” while block groups with lower concentrations of multiple asset categories are “secondary centers” and those with high concentrations of a single asset type are “monocenters.”
As might be expected, the largest concentration of primary centers in the Washington region is in downtown DC and adjacent parts of the District’s commercial core: nearly every block group in the area bounded by Rock Creek, P Street NW, Massachusetts Avenue, North and South Capitol Streets, the Southwest Expressway, and the Potomac is a primary center, as are the Wharf and the area around Union Station. Other primary centers are found at the St. Elizabeth’s campus in Southeast, in the vicinity of the RFK Stadium site, and at American University. Overall, 13% of the developed land area in the District is part of a primary center, while nearly a third is part of activity centers in general.
Primary centers—often surrounded by clusters of secondary and monocenters—are found in the suburbs, as well. In Montgomery County, transit-oriented development around the Silver Spring, Bethesda, and Friendship Heights Metro stations forms the basis for activity center clusters anchored by primary centers. In Arlington, the Rosslyn-Ballston Corridor and Crystal City areas consist of large clusters of secondary and monocenters containing a few primary centers, as do the King Street corridor in Old Town Alexandria and Tysons in Fairfax County.
In addition, Prince George’s County has its sole primary center in the University of Maryland campus while isolated primary centers can be found further out in Northern Virginia on the George Mason University campus and the downtowns of Manassas, Fredericksburg, and Culpepper. Meanwhile, a cloud of secondary centers and monocenters can be found throughout the region, mostly centered on suburban office parks, hospitals, and shopping malls.
Activity centers in the DC metro area. Primary centers are orange, secondary centers are yellow, and monocenters are blue. Image courtesy of Brookings Metro. used with permission.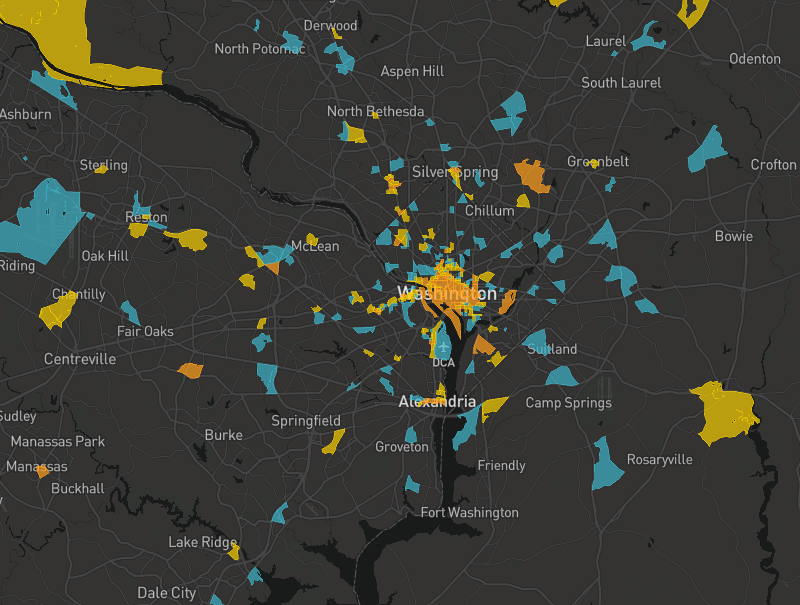
DC’s activity centers are dense, but DC is more polycentric than other cities with dense activity centers
While we constructed activity centers based on the distribution of a number of different asset types, median job density gives a good approximation of how densely concentrated assets are in activity centers overall. DC does very well in terms of median job density in its activity centers: at 88,000 jobs per square mile, it falls in third place nationally, just behind Boston, and is one of only six metro areas with at least 40,000 jobs per square mile in its median activity center. (New York, unsurprisingly, is three times denser than second-place Boston, with nearly 300,000 jobs per square mile in its median activity center.)
| Rank | Metro Area | Activity Center Job Density |
Primary Center Job Density |
| 1 | New York, NY | 299,000 | 698,000 |
| 2 | Boston, MA | 90,000 | 292,000 |
| 3 | Washington, DC | 88,000 | 186,000 |
| 4 | San Francisco, CA | 71,000 | 328,000 |
| 5 | Honolulu, HI | 63,000 | 84,000 |
| 6 | Seattle, WA | 41,000 | 88,000 |
| 7 | Philadelphia, PA | 33,000 | 234,000 |
| 8 | Los Angeles, CA | 30,000 | 42,000 |
| 9 | Denver, CO | 29,000 | 66,000 |
| 10 | Chicago, IL | 29,000 | 255,000 |
| 11 | New Orleans, LA | 26,000 | 46,000 |
| 12 | Portland, OR | 25,000 | 72,000 |
| 13 | Atlanta, GA | 25,000 | 81,000 |
| 14 | Minneapolis, MN | 24,000 | 131,000 |
| 15 | Nashville, TN | 23,000 | 58,000 |
| 16 | San Jose, CA | 22,000 | 38,000 |
| 17 | Austin, TX | 22,000 | 61,000 |
| 18 | Madison, WI | 21,000 | 54,000 |
| 19 | Pittsburgh, PA | 20,000 | 155,000 |
| 20 | Miami, FL | 20,000 | 34,000 |
However, if we focus on primary centers—the strongest activity centers—the Washington region drops to sixth place, behind New York, San Francisco, Boston, Chicago, and Philadelphia, and just ahead of Pittsburgh and Minneapolis. Furthermore, while retail and hospitality jobs are more concentrated in activity centers in the DC region than nationally, industrial and business services jobs and GSA-owned Federal office space are less concentrated in activity centers than nationally.
While DC’s activity center strength is based on the size and density of downtown DC—one of the nation’s largest central business districts—along with dense development near Metro stations in Montgomery County, Arlington, and Alexandria, the metro area as a whole is less monocentric than other very dense metro areas, such as Boston, where nearly all primary centers are found in downtown Boston and the dense urban neighborhoods of the Back Bay and Cambridge, and a larger share of secondary and monocenters are found very close to the urban core than in DC.
Activity centers in the Boston metro area. Primary centers are orange, secondary centers are yellow, and monocenters are blue. Image courtesy of Brookings Metro. used with permission.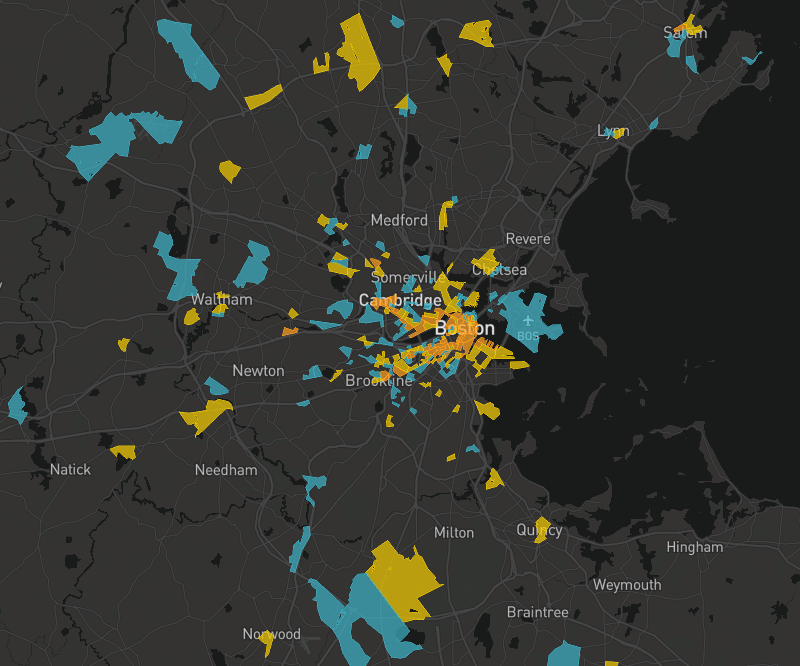
On the other hand, the DC region is not nearly as polycentric as freeway-oriented regions like Atlanta. With the exception of one primary center in Tysons—one of the country’s largest and densest “edge city” developments—and the University of Maryland and George Mason University campuses, all of our region’s primary centers consist of transit-oriented development or historic downtowns. In Atlanta, on the other hand, the freeway-oriented edge-city developments of Buckhead and Sandy Springs/Perimeter Center each contain multiple primary centers, and primary centers are also found in a number of other edge-city developments. Likewise, the secondary and monocenters in the Atlanta region are generally more spread out than those in the Washington region.
Activity centers in the Atlanta metro area. Primary centers are orange, secondary centers are yellow, and monocenters are blue. Image courtesy of Brookings Metro. used with permission.
What this means for the Washington region
Understanding where the region’s activity centers are and directing development in and around them is particularly important because strong activity centers have a number of benefits for regions. As we show in our report, metro areas with denser activity centers have higher productivity overall, as well as higher rates of green commute usage such as public transportation, walking, and biking.
Likewise, activity centers are important because of the degree to which they concentrate metro areas’ assets: nationally, activity centers host 40% of private-sector jobs, 91% of college staff, 83% of hospital beds, and 88% of Federal office space on just 11% of developed land. Likewise, activity centers are home to 46% of the assessed value of the taxable real estate (22% in primary centers alone) nationally. In DC, this concentration of wealth is even greater, with 60% of all commercial real estate value in activity centers and 35% in primary centers alone.
In the Washington region, land near activity centers should be a particularly high priority for residential upzoning, because the price per square foot of residential property has a 63% premium—the third-highest in the nation—when it is within a mile of an activity center. Building more housing in these areas would give new residents access to jobs, civic institutions, and retail concentrated in activity centers while reducing their automobile dependence.
For more detailed takes on the importance of activity centers, you can download our full report from the Brookings Metro website and download our data, including statistics on all activity centers in the country from Github.
Disclosure: Tracy Hadden Loh, GGWash’s board chair, is an author of the original Brookings report referenced in this article. Per our editorial policy, she has no editorial input.