Rail ridership is up, bus ridership may be leveling off, and we can learn all this from a new Metro data tool

Change in rail ridership, November 2018 to November 2019. All images generated from the WMATA Ridership Data Portal.
Want to know how many riders there are on a certain bus line, or Metro station? How much it’s changed over time? How weekends compare to weekdays? Now you can learn that and more, thanks to a new data portal WMATA released in December. It has three tools, one for rail ridership, one for bus, and one for parking.
This holiday present to analysts and curious riders is a significant step forward in helping the public better understand Metro, and has already yielded some very interesting information. Here are a few takeaways I and contributors were able to glean so far. Take a look and let us know what you see!
Ridership is rising on the train
People have been going back to riding the rails after years of declines. The map at the top of this article shows the year over year changes for November 2019 versus November 2018. Ridership at every station rose except for three in Alexandria and four on the east side of the region.
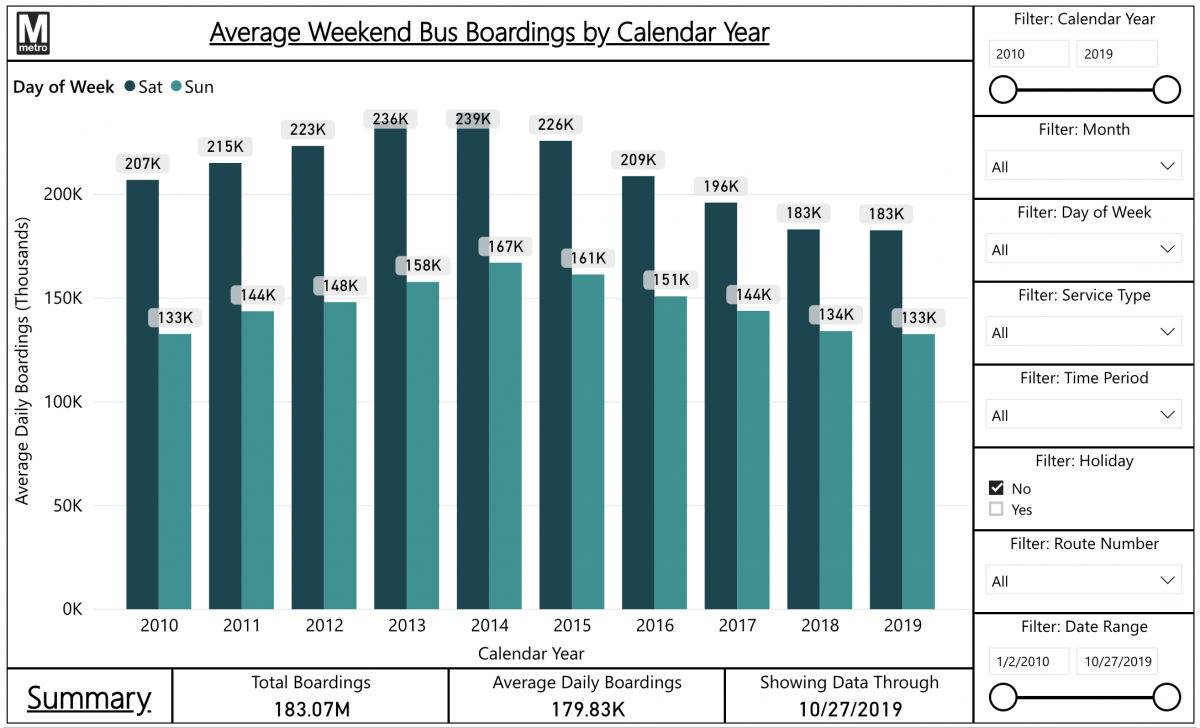
Both weekday and weekend ridership rose in 2019, reversing a trend on the rails going back to 2011. James Pizzurro, lead developer for the popular transit app MetroHero, shared some graphs he made with the portal:


Of course, there is still a significant way to go to recover ridership back to the 2011 peak, but it’s moving in the right direction.
Bus losses may be leveling off
Bus ridership still hasn’t risen year over year, but its multi-year decline flattened out somewhat in 2019.

It’s down more if you just look at November-to-November; the strike at the Cinder Bed Road garage may have been a factor in November 2019 being a more negative trend than the year as a whole.
Whether the ridership turns upward or not will depend a lot on decisions WMATA and jurisdictions must make. The current budget proposal would cut bus service, which would almost certainly also drive away riders. (As would ongoing labor relations problems.)
On the other hand, the recent Bus Transformation Project recommended an aggressive set of actions from local jurisdictions, including adding bus lanes, making the bus more frequent and convenient (the opposite of the budget’s actions), improving the customer experience with better information and easier ways to pay, and in the longer term, redesigning the bus network to be more effective.
Extending the Yellow Line and building homes added riders
Here are the stations that gained the most riders between November 2018 and November 2019:

The tool won’t tell us why, but it seems that some of these, including #1 gainer U Street, benefited from the Yellow Line being extended to Greenbelt in late May. Columbia Heights and Georgia Ave-Petworth also were among the stations with the most increase.
Many of these other stations, like “New York Ave” (now called NoMa), Navy Yard, Crystal City, and most of all the Tysons stations, have seen considerable new development. When people live near a Metro station they are much more likely to ride it, and not just for commuting but for more everyday uses. That ridership is also less fickle.
One might also note that none of these top stations are in Maryland.
Rail ridership is less variable than parking
Compare the parking usage by day of the week (top) with the rail ridership by day of the week (bottom):


As you can see, the rail ridership is much more stable. (And it’s interesting the parking use is a bunch lower not just on Fridays, when rail ridership drops, but on Mondays!) This is because using the parking is very much a workday commuter kind of thing, while people who live near stations ride at other times. After all, if going somewhere on a weekend even if it’s where Metrorail goes, why drive and park when trains are infrequent and traffic is light?
This is one reason transit planners generally favor more housing, offices, and retail near rail stations as opposed to more parking. (Other reasons include fiscal impact, carbon footprint, stormwater management, and creating reverse commute opportunities; the agency published research on this in 2015.) Someone should tell that to Maryland board member Michael Goldman.
Releasing this information is a big step for WMATA
One of the most notable takeaways from this ridership data portal is about the existence of the ridership data portal itself. WMATA has, in recent years, been reluctant to provide raw data and information about its operations. The agency releases reports now and then which summarize some information and has an excellent set of ridership “snapshots” on the data portal page, but there are so many potential questions these do not answer.
For instance, Pizzurro said, “This [portal release] may be the first time the public has had access to off-peak weekday ridership numbers; most of the data published by WMATA up until this point has looked exclusively at peak weekday ridership, followed by weekend ridership, but very little to nothing about off-peak weekday ridership, which is also up compared to last year.” He added that this portal provides previously-unavailable parking insight as well.
Media organizations have filed requests through PARP, the WMATA equivalent of FOIA, but these can take months after which time they are often out of date, and are often denied, sometimes seemingly just because the legal department can rather than about the merits of secrecy or transparency. A blog from the Metro planning department, PlanItMetro, often shared extremely useful information until January of 2017 when new articles quietly and abruptly ceased.
It’s probably in the public’s and region’s best interest for information to be more readily available. I’d also argue it is in WMATA’s best interest. In the secrecy posture of past years, reporters had to dig and dig for any knowledge, putting them in an adversarial relationship with Metro. Even mundane facts, by virtue of being so hard to find, would seem to be scandalous. And people who honestly wanted to better understand transit, write research analyses, or create useful rider tools would be stymied, and thus pushed into a confrontational posture.
Outside eyes can help an organization realize things it didn’t know and potentially improve. And it’s not bad for Metro if, say, some experts and advocates outside the agency come up with good ideas — or even bad ones which don’t end up being implemented. In fact, having more people suggest ways to improve transit means more people are pushing to improve transit. It’s working well in Boston.
Many transit supporters here were been so put off by WMATA obtuseness over the years that they gave up on trying to be transit allies. Even some of the agency’s harshest critics started out trying to be constructive and then hit such a brick wall they changed their view. It’s a truism in all of the public sector that involving people is more constructive than shutting them out.
With this data release, WMATA is taking a meaningful step forward. It builds on another good decision to host the regular “Metro Hack Night” for app developers at the WMATA headquarters. Coders were convening regularly to talk about how to analyze data and build apps already; it would seem clearly beneficial for WMATA to encourage this and work constructively with the software community. The next Metro Hack Night, by the way, is on January 22, again at WMATA.
Perhaps if transit supporters cheer this release, journalists are able to make good use of it, and the sky doesn’t fall in for the agency, Pizzurro suggested the agency in the future will feel more comfortable sharing information which can improve our collective understanding of what is going on with an important public service that so many in the region depend on and want to see succeed.
There are some ways to improve the portal
This is a first release of the data portal, and users have been suggesting numerous improvements, such as these:
- You can’t link directly to a particular view. Right now, if you adjust the sliders and selectors and generate a helpful graphic, you have to screen shot it and post it to something like Twitter, but can’t simply link people to that view.
- The year-over-year change report seems to only work for November 2019 to November 2018 and no other times. Switch to another month and you get no data. This means, in particular, that we can’t really understand year-over-year weekend trends, because in 2018 the Sunday after Thanksgiving was in November, but last year it was December 1, and thus not included. Therefore, the portal shows huge year-over-year Saturday gains and huge Sunday losses, which doesn’t really mean anything.
- It would be useful to be able to filter rail or bus lines by line (i.e. Green), or jurisdiction (all Virginia stations). For instance, it’d be interesting to see whether the fact that Maryland stations weren’t among the top gainers means that Maryland actually isn’t gaining much ridership, or if that’s just about the outliers.
- Downloading the data points from a particular report would be very helpful to be able to put it into other formats or do some additional kinds of comparisons.
Play with the portal yourself. There’s so much more to understand beyond just what’s above. What do you find? And, do you have suggestions for improving the tool?