Here’s what Metro delays look like in bad weather (like last week’s freezing temperatures!)

Image by Matt’ Johnson licensed under Creative Commons.
Bad weather tends to go hand in hand with longer Metrorail delays. Delays usually last the longest when it’s freezing outside, with the situation being a bit better when it’s snowing and even better when it’s only raining.
Between January 2013 and January 2017, there was some kind of Metrorail delay virtually every day; nearly 20% of Metro trains arrived late in 2016. That may sound alarming, and it’s certainly bothersome, but Metro isn’t alone when it comes to delays being part of a standard day: in New York City, for example, 25% of subway trains were late every day in 2014. And like with Metro, the situation in New York isn’t getting any better as delays have increased over 150% for NYC buses and subway trains over the last four years.
While there is a delay just about every day, the length of the delay really ranges. We recently dug into 604 days’ worth of data on inclement weather between January 2013 and January 2017, looking at how bad weather tends to impact Metro delay times.
While we can’t say that bad weather caused the corresponding delay times, we certainly can observe the correlation between bad weather and changes in delay times.
First, let’s look at the baseline
From January 2013 to January 2017, the average Metrorail delay was between six and eight minutes long; delays fell into that time window 45% of the time.
Image by the author, made using the Keshif data explorer. 
The second most common delay time over the last four years was between eight and 10 minutes. 27% of waits were that long, meaning that just about 75% of all delays between 2013 and 2017 were 6-10 minutes in length.
Knowing the average for all delays, it stands to reason that the frequency and length would differ for days with inclement weather. In the chart below, the top row shows the same information as the graph above while the three rows below it show the average daily Metrorail delay time during freezing temperatures, snow, and rain.
Image by the author, made using the Keshif data explorer. 
The middle black lines show the median of the daily averages for each weather type, and lines on left/right show percentile ranges.
As you can see, delays were relatively higher when it was freezing (red row) compared to the typical (all conditions, top row).
Below you can see a break out of the five most common delays ranges (ie 6-8 min, 8-10 min etc) for each type of weather and comparison to overall conditions.
On freezing days, delay times got longer
The chart below shows how long the average delays were on all freezing days between 2013 and 2017. 34% of all delays on these days were between six and eight minutes, and 66% of all delays during freezing temperatures were 6 to 10 minutes.
Image by the author.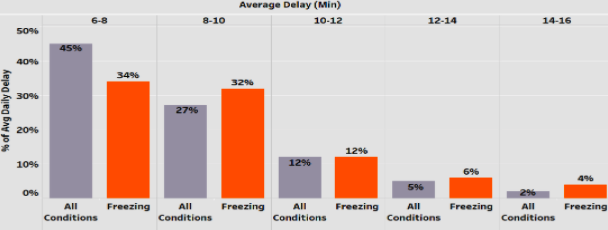
Average delays times between overall conditions and freezing temperatures appear to occur when factoring in longer delay times. For example, there is a 9% drop in 6-8 minute delays on days with freezing temperatures in comparison to all conditions. However, with the exception of 10-12 minute delays, every single delay range saw an increase on days with freezing temperatures in comparison to overall conditions.
The percentage of 8-10 minute, 12-14 minute, and 14-16 minute delays increased as temperatures dropped to freezing levels. During freezing temperatures, 8-10 minute delays happened 5% more frequently than on the average day. Drops in temperature also coincided with spikes in 14-16 minute wait times growing by 2%. Even when we looked at a single day (Jan 25, 2014), we were chilled to learn delay times averaged 22 minutes!
Average delay times were also longer on snow days, but the increase wasn’t as big as freezing days
Image by the author.
Like when temperatures were freezing, snow days meant more delays. Interestingly, some of these increases were identical, such as the shift from 5% to 6% in 12-14 minute delays. Overall, however, there was more of an increase in delays and the delays were longer when temperatures were freezing.
On snow days, there was a 3% increase in 8-10 minute delays (that number was 5% on freezing days). Also, for longer delays, there was a 1% drop in 14-16 minute delays.
Rain doesn’t appear to affect Metrorail delay times in comparison to overall weather conditions
Image by the author.
With the exception of occasionally making your platform wait feel like a scene out of Noah’s Ark, rain doesn’t seem to affect Metro’s delay times. Rainy days saw the smallest increase (2%) of all three inclement weather types in delays averaging 8-10 minutes. Rainy days were also the only inclement weather type where there was an actual decrease in 12-14 minute delays.
It would be hard to argue against the statement that Metro's rail reliability issues have numerous operational root causes. But based on the data, it seems weather conditions, like freezing temperatures, only make matters worse.
Stay tuned for our next installment, when we look at specific types of delays— known as disruptions— and how they’re related to weather.
Notes: Data observations were made with data discovery tool, Keshif (www.keshif.me). To explore this dataset yourself with Keshif please see interactive the Keshif data explorer. Metro disruption data obtained from Code for DC, weather data from NOAA.gov.