Calculate your commuting emissions with Metro’s new tool
Photo by Leonski Oh Leonski on Flickr.
Earlier this fall, WMATA’s sustainability team developed a greenhouse gas (GHG) emissions savings calculator and have launched a draft version on their blog, PlanItMetro. You can use it to compare their carbon footprint when taking transit or driving.
The tool is simple and intuitive to use, similar to WMATA’s trip planner. Enter your origin and destination and the calculator will give you options for how to arrive at your destination via transit or by driving, and will tell you the total amount of CO2 emissions for each option. If your trip involves walking, the calculator will even give you an estimate of the calories you expended in the process.
Check out a sample entry I did for a trip I used to make from my old place in College Park as a student at the University of Maryland to the Coalition for Smarter Growth office near Union Station. By taking the Metro rather than driving, I reduced my carbon footprint by 61% and burned over 90 calories in the process.
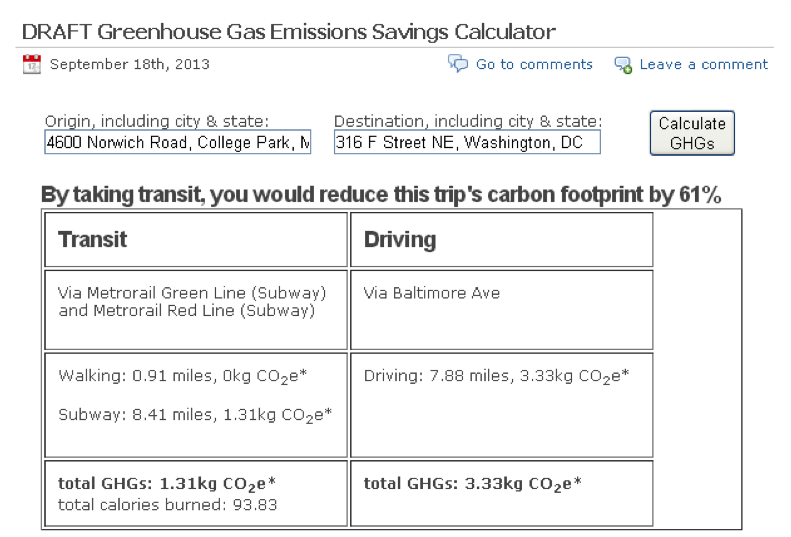
Metro’s carbon footprint calculator.
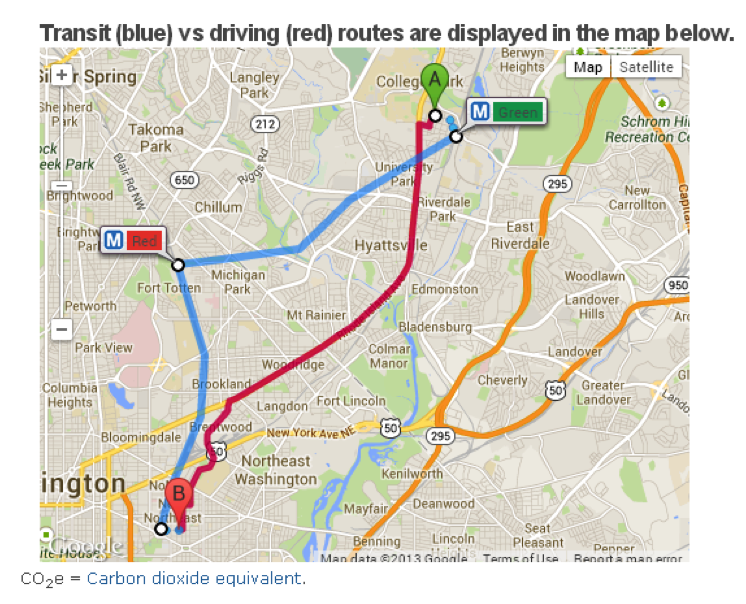
A map of transit versus driving routes.
The transit emissions the tool calculates represent your slice of the total emissions pie of Metro’s fleet divided by all Metrorail or Metrobus riders. Since we have already invested in these transit systems, every additional person who boards a bus or train improves the efficiency of the overall system, while avoiding the emissions they would generate by driving.
But it’s also instructive to see the significant emissions our transit vehicles emit. Reducing transportation emissions by using cleaner fuels for Metrobus and Metrorail should be a goal for our transit system as well. Public concerns over natural gas have been increasing, given the devastating environmental impacts of fracking. Recent studies suggest that natural gas’ net climate impact may be even worse than coal.
Metro wants to move from using traditional diesel or natural gas vehicles to diesel hybrid buses. Today, the bus fleet consists of 41% hybrids, which will rise to 62% by 2018.
The emissions figures from riding Metrorail are based on the amount of electricity the system uses from Maryland’s and Virginia’s electricity grids. Maryland and Virginia currently both generate over half of their electricity from fossil fuels.
Maryland must generate 20% of its energy from renewable sources by 2020, and passed a major offshore wind bill last year. Virginia is lagging behind Maryland, having only adopted a voluntary renewable portfolio standard. Someday, if we have a clean grid, Metro could also consider running trolley buses on clean energy like in Seattle and San Francisco.
If we are to lower emissions at the rate and degree scientists say is necessary to avert climate disaster, we will have to find a way to dramatically reduce our transportation emissions, which make up 30% of the Washington DC region’s carbon emissions. Tools like WMATA’s offer the opportunity for individuals to understand the environmental impact of their commutes and the benefits of walking, bicycling, and transit use.
Still, behavior change is difficult, and studies have found that carbon calculators tend to reach a limited and self-selecting audience. So how can WMATA improve the tool to maximize its impact?
One idea would be to illustrate the meaning of “kilograms of CO2” in easily understandable ways by comparing it to gallons of gas, the cost of gas, or home energy use. WMATA could potentially use data from this tool from the EPA, which compares kilograms of CO2 to a wide variety of everyday energy uses.
It would also be great if the tool incorporated more options, especially biking to transit stations. In testing WMATA’s calculator, we also found that it didn’t offer biking or bikeshare as options where those appear to be a convenient alternative.
In addition, the emissions savings from one trip may not be a huge motivator, but what if you could see the impact of riding transit and ditching your car for a whole year? Driving represents by far the biggest share of the typical American’s carbon footprint, so switching to other modes over the long term is one of the most important actions an individual can make to fight climate change. The following chart shows the major contributors to the average household’s carbon footprint.
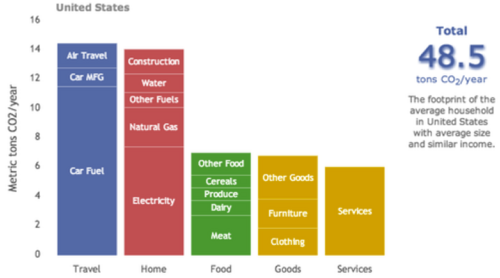
Graph from NRDC and UC Berkeley.
Finally, WMATA’s tool could work in concert with the Housing + Transportation Cost Calculator pioneered by the Center for Neighborhood Technology and adopted by the federal Partnership for Sustainable Communities to show how transit-accessible neighborhoods can not only reduce your carbon footprint, but your living expenses as well.
What ideas do you have to improve WMATA’s greenhouse gas tool? Let us know in the comments.