Real-time data enables amazing Boston bus art
Two self-described “cartography geeks” took publicly available real-time position data for Boston buses and created this image that’s part map, part piece of art:
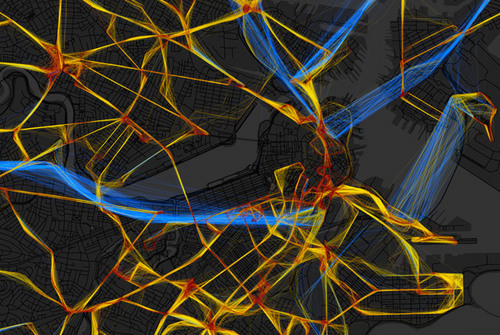
Image from Bostonography.
The image color-codes bus trips by their average speed. Buses are fastest on freeway segments, slower on most city streets, slowest in the dense neighborhood cores. Some of this is road speed, but buses also move more slowly in areas where there are more stops and more people boarding and alighting.
Since buses only report their location every few minutes and can’t report inside tunnels, the bluest lines show up as fuzzier sets of spread-out lines.
WMATA created a similar, but more diagrammatic and less artistic, set of maps for DC buses:

Image from WMATA.
This is just one of the many applications people can create on their own, thanks to having open data publicly available. The more transit agencies provide, the more useful tools people can create, whether very practical mobile apps or beautiful and informative visualizations like this one.