Posts tagged Maps
-

How much land is in each quadrant of the District?
How much of each of DC’s quadrants is land? Water? Parks? Military bases? The quadrants aren’t all equal. Far from it. I created this map using shapefiles from DC OCTO to illustrate how the areas differ. Keep reading…
-

These maps show how incomes have changed in the region since 1980
Although the spatial distribution of wealth in the Washington region has remained relatively constant over the past 40 years, with the richest neighborhoods stretching to the northwest on both banks of the Potomac and the poorest neighborhoods inside the Beltway east of 16th Street NW, the number of very rich and very poor neighborhoods has increased. Keep reading…
-

National links: Vienna, Austria is one of the most livable cities. What’s its secret?
We can learn a lot from Vienna, Austria, one of the world’s most livable cities. Minnesota has a long game to add more dense zoning. Chicago’s in a losing battle with Planned Manufacturing Districts. Keep reading…
-

Check out these beautiful color-coded maps of the region’s streets and roads
Street names can tell stories. Sometimes street names give us big headlines, like when Route 1 in Crystal City was recently changed from “Jefferson Davis Highway” to “Richmond Highway.” Sometimes street names reveal unexpected details. Beach Drive, in Rock Creek Park, has a surprisingly landlocked origin story. Its namesake, Lansing Hoskins Beach, was born in Iowa. Keep reading…
-

A city is only as accessible as its sidewalks. This map shows DC’s are often blocked.
The walk score of a neighborhood is important to many people. It can determine where you choose to live. However, what is not factored into the walkability score of a neighborhood is the actual condition of the sidewalks. Keep reading…
-
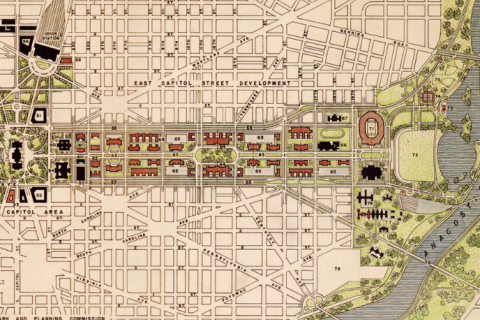
This map shows a 40s-era plan to make East Capitol an expansive avenue
In the 1940s, there was a proposal to make East Capitol Street into a wide, monumental avenue. This map shows what it would look like, and provides some other glimpses into what DC was like at the time. Keep reading…
-

Why do we use colors to name our transit lines?
There are numerous ways to distinguish transit lines, including using unique names or symbols. Here and many places elsewhere, our subway goes with colors. That’s because colors are a simple and user-friendly way to organize a system. Keep reading…
-
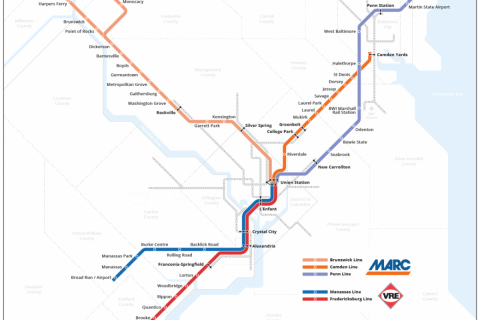
Maryland and Virginia’s commuter rail look great together on one map
Maryland’s MARC train and Virginia’s VRE are very similar regional rail systems. This map shows what they might look like as a single integrated regional network. Keep reading…
-

These beautiful maps show how the region’s population density changed since 1970
DC’s population growth has slowed since the 2009 boom 10 years ago, but the population still continues to climb. In December, the US Census Bureau announced that DC’s population reached 702,455, officially passing the 700,000 mark. Keep reading…
-

These maps illustrate how big Dulles and BWI airports are
Dulles and Baltimore Washington International airports can sometimes feel like they’re not all that close to the District. But what would happen if they were built closer to DC? Like, in DC itself? Keep reading…